Descrição
Indicadores da loja Pinescriptlabs: 🤖Pinescriptlabs Loja cBots : (cBot) Gold & BTC BreakoutSession Pivots(novo)
Mapa de Liquidação de Alavancagem
Previsão Baseada em Linreg & ATR
SmartTrend Suporte &
Resistência
Linhas
Sistema de Rompimento de Canal
Análise
Dinâmica
da Estrutura
de Mercado
dos Pontos
de Reversão
Regressão
Linear
Fibonacci
Multi-temporal
Gap de Valor Justo de Momentum
Gradiente de Tendência Dinâmico
Rastreador
de Viés
de Velas
Multi-Nível
Tracker
Rastreador de Extremos Zig-Zag
Linhas
de Tendência
de Suporte e
Resistência
Automáticas
Todos
os Níveis
de Suporte e
Resistência
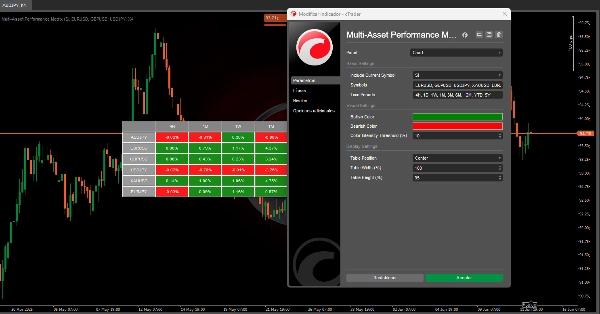
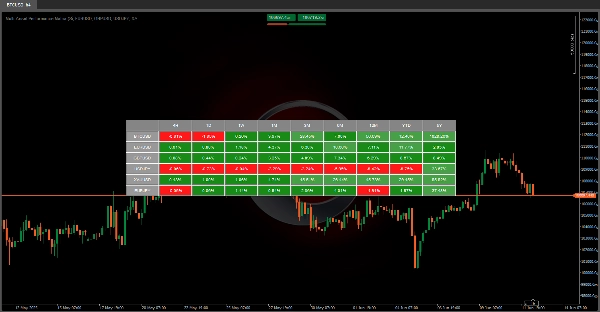
🚀 MATRIZ DE DESEMPENHO MULTI ATIVO 🚀
Este algoritmo é uma ferramenta visual poderosa 📊 projetada para exibir o desempenho percentual de múltiplos instrumentos financeiros em diferentes períodos de tempo.
Ele transforma dados históricos em uma visualização eficiente e intuitiva, permitindo que os usuários avaliem rapidamente o comportamento de vários ativos financeiros.
❓ O Que Esta Ferramenta Faz?
1️⃣ 📈 Compara Ativos: Mostra como os preços de diferentes instrumentos financeiros (como BTCUSD, EURUSD, XAUUSD, etc.) mudaram ao longo do tempo.
- Intervalos de tempo: D (Diário) | 1W (Semanal) | 1M (Mensal) | 3M (Trimestral) | 6M (Semestral) | 12M (Anual) | YTD (Ano até a Data) | 5Y (Últimos 5 Anos)
2️⃣ 🎨 Destaca Tendências: Usa codificação por cores (🟢, 🔴 ) para identificar instantaneamente quais ativos estão subindo ou caindo em cada período.
3️⃣ ⏱️ Atualizações Automáticas: Atualiza os dados a cada minuto para refletir as informações mais recentes do mercado.
💡 Por Que Isso É Útil?
✔ 📊 Análise Comparativa: Permite comparações lado a lado de múltiplos ativos—ideal para gestão de portfólio ou seleção dos ativos com melhor desempenho com base nos horizontes temporais.
✔ 🛡️ Controle: Avaliar a consistência (ou volatilidade) de um ativo em diferentes períodos ajuda a avaliar os riscos associados.
✨ Chave
✅ ⏳ Economiza Tempo: Coletar e calcular esses dados manualmente levaria horas—esta ferramenta faz isso instantaneamente!
✅ 👀 Visualmente Claro: O sistema codificado por cores torna a análise fácil, mesmo para usuários não técnicos.
✅ 🔄 Adaptável: Suporta símbolos personalizados, para que você possa acompanhar os ativos que são importantes para você.
Resumo
Avaliações de clientes
5 | 100 % | |
4 | 0 % | |
3 | 0 % | |
2 | 0 % | |
1 | 0 % |