
Deskripsi
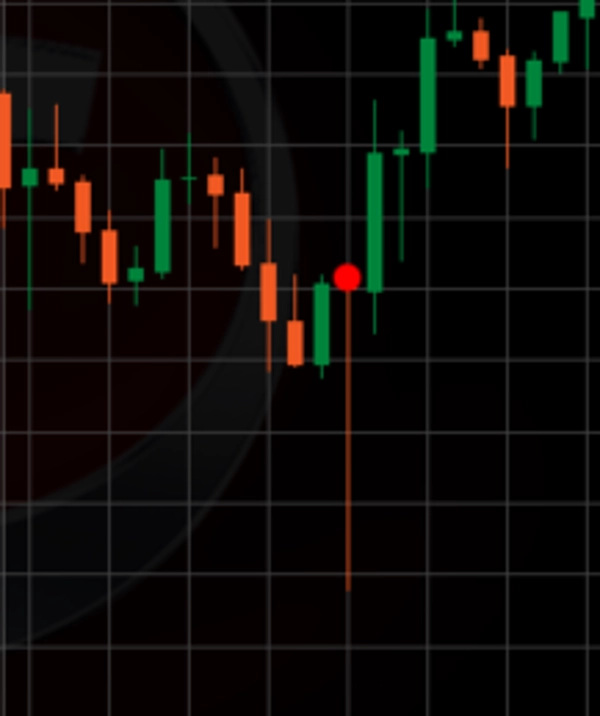
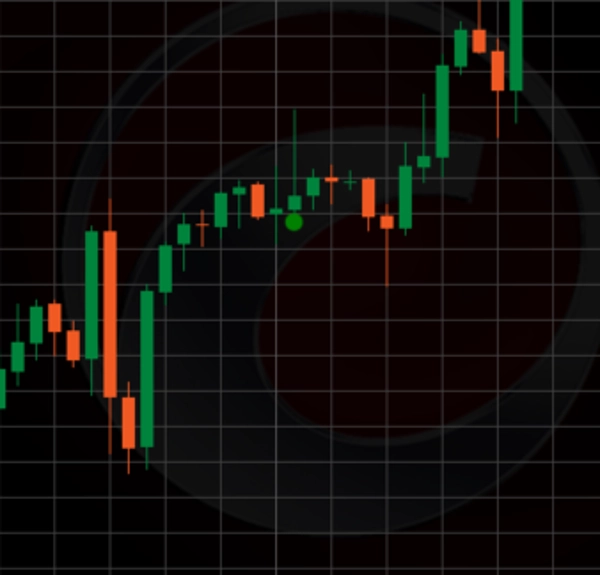
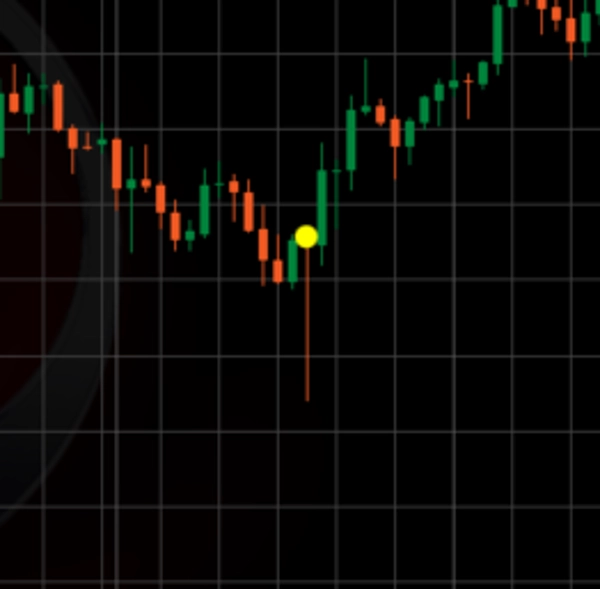
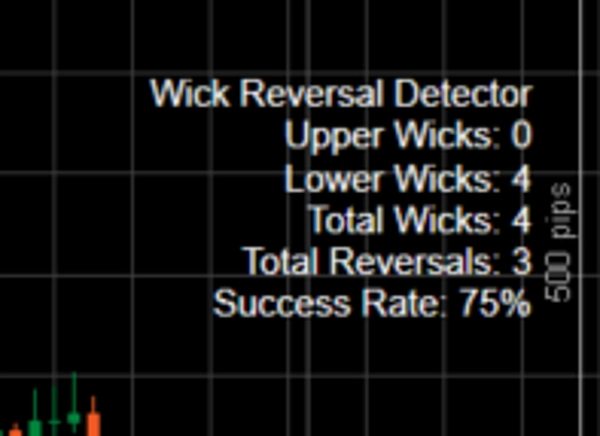
Indikator Long Wick adalah alat analisis teknikal yang kuat yang dibuat untuk cTrader yang berfokus pada identifikasi candle dengan sumbu yang sangat panjang—baik atas maupun bawah—relatif terhadap ukuran tubuhnya dan rata-rata rentang candle. Ini menyoroti sumbu-sumbu ini di grafik sebagai titik pembalikan potensial, di mana pasar mungkin telah menolak harga yang lebih tinggi (untuk sumbu atas, menunjukkan pembalikan bearish) atau harga yang lebih rendah (untuk sumbu bawah, menunjukkan pembalikan bullish). Indikator ini menggunakan kombinasi pengali ambang sumbu, rasio minimum sumbu terhadap tubuh, dan Simple Moving Average (SMA) penyaring tren untuk menyaring noise dan fokus pada pola penolakan harga yang signifikan. Setiap sumbu yang terdeteksi ditandai dengan lingkaran (hijau untuk sumbu atas, merah untuk sumbu bawah jika dikonfirmasi sebagai pembalikan, atau kuning jika tidak), dan data statistik (misalnya, total sumbu, pembalikan, dan tingkat keberhasilan) ditampilkan di grafik untuk memudahkan pelacakan.
Cara Menggunakan dalam Trading:
- Mengidentifikasi Peluang Pembalikan: Gunakan indikator untuk menemukan sumbu panjang yang terjadi di level support atau resistance kunci, atau melawan tren yang sedang berlangsung (misalnya, sumbu bawah panjang dalam tren turun untuk potensi pembalikan bullish). Lingkaran hijau atau merah yang solid menunjukkan pembalikan yang dikonfirmasi berdasarkan aksi harga dalam periode lookforward, menjadikannya sinyal untuk mempertimbangkan masuk perdagangan ke arah berlawanan (misalnya, beli pada pembalikan sumbu bawah merah, jual pada pembalikan sumbu atas hijau).
- Konfirmasi dengan Alat Lain: Gabungkan indikator Long Wick dengan indikator teknikal lain (misalnya, RSI, MACD, atau garis support/resistance) untuk mengonfirmasi sinyal pembalikan dan menghindari sinyal palsu, terutama di pasar yang bergejolak.
- Manajemen Risiko: Tempatkan order stop-loss di luar ekstrem sumbu (misalnya, di bawah low untuk pembalikan bullish) untuk melindungi dari kemungkinan pembalikan gagal, dan tetapkan level take-profit berdasarkan support/resistance terdekat atau rasio risiko-imbalan (misalnya, 1:2).
- Memantau Tingkat Keberhasilan: Secara rutin periksa tingkat keberhasilan yang ditampilkan untuk menilai efektivitas indikator dari waktu ke waktu dan sesuaikan strategi Anda sesuai kebutuhan.
Menyesuaikan Parameter untuk Penggunaan Terbaik:
- Periode Lookback (Default: 5): Menentukan jumlah bar yang digunakan untuk menghitung rata-rata rentang candle. Periode yang lebih pendek (misalnya, 3-10) membuat indikator lebih sensitif terhadap volatilitas terbaru, ideal untuk pasar yang bergerak cepat, sementara periode yang lebih panjang (misalnya, 20-50) meratakan rata-rata untuk kondisi tren. Sesuaikan berdasarkan timeframe Anda (misalnya, lebih rendah untuk grafik 1 menit, lebih tinggi untuk grafik 1 jam).
- Periode Lookforward (Default: 15): Menetapkan jumlah bar untuk mengonfirmasi pembalikan. Periode yang lebih pendek (misalnya, 5-10) cocok untuk strategi scalping cepat, sementara periode yang lebih panjang (misalnya, 15-30) lebih baik untuk swing trading guna menangkap pembalikan yang lebih lama. Tingkatkan jika Anda melihat terlalu banyak tanda kuning di mana pembalikan terjadi kemudian.
- Pengali Ambang Sumbu (Default: 1.3): Mengalikan rata-rata rentang candle untuk menetapkan panjang sumbu minimum. Nilai yang lebih rendah (misalnya, 1.0-1.5) mendeteksi lebih banyak sumbu (berguna di pasar dengan volatilitas rendah), sementara nilai yang lebih tinggi (misalnya, 2.0-3.0) menyaring hanya sumbu yang paling signifikan (lebih baik di pasar dengan volatilitas tinggi). Sesuaikan ini untuk menyeimbangkan sensitivitas dan kualitas sinyal.
- Periode Tren (SMA) (Default: 21): Menentukan panjang SMA untuk penyaringan tren. Periode yang lebih pendek (misalnya, 10-20) merespons tren jangka pendek, sementara periode yang lebih panjang (misalnya, 50-100) sesuai dengan tren jangka panjang. Sesuaikan untuk mencocokkan horizon trading dan kondisi pasar Anda.
- Rasio Minimum Sumbu terhadap Tubuh (Default: 3): Menetapkan rasio minimum panjang sumbu terhadap ukuran tubuh. Rasio yang lebih rendah (misalnya, 2-3) mencakup lebih banyak candle dengan sumbu sedang, sementara rasio yang lebih tinggi (misalnya, 4-5) fokus pada candle dengan sumbu yang sangat menonjol. Tingkatkan untuk sinyal pembalikan yang lebih ketat, turunkan untuk lebih banyak peluang.
- Toleransi Pembalikan (Pips) (Default: 5): Memungkinkan toleransi dalam pips untuk harga yang melampaui ekstrem sumbu sebelum membatalkan pembalikan. Nilai yang lebih kecil (misalnya, 2-3) memastikan konfirmasi pembalikan yang ketat, sementara nilai yang lebih besar (misalnya, 5-10) mengakomodasi retracement kecil. Sesuaikan berdasarkan nilai pip dan volatilitas simbol.
Tips Optimasi:
- Mulailah dengan pengaturan default dan lakukan backtest pada data historis untuk instrumen dan timeframe pilihan Anda.
- Di pasar yang sedang tren, tingkatkan Pengali Ambang Sumbu dan Rasio Minimum Sumbu terhadap Tubuh untuk fokus pada sinyal pembalikan yang lebih kuat.
- Di pasar yang sedang sideways, turunkan parameter ini untuk menangkap lebih banyak sumbu, tetapi padukan dengan Periode Lookforward yang lebih pendek untuk menghindari diskualifikasi terlambat.
- Secara rutin tinjau tingkat keberhasilan dan sesuaikan parameter jika turun di bawah ambang yang dapat diterima (misalnya, 70%).
Dengan menyesuaikan parameter ini, trader dapat menyesuaikan indikator Long Wick dengan strategi spesifik mereka, meningkatkan efektivitasnya dalam menemukan titik pembalikan dengan probabilitas tinggi dalam berbagai kondisi pasar.
Ringkasan
Traders can use the indicator to spot reversal opportunities at key support or resistance levels or against prevailing trends. It is recommended to confirm signals with other technical tools such as RSI or MACD and to apply risk management by placing stop-loss orders beyond wick extremes. The indicator’s parameters—including lookback and lookforward periods, wick threshold multiplier, SMA trend period, minimum wick-to-body ratio, and reversal tolerance—are adjustable to suit different market conditions and trading styles. Regular review of the success rate helps optimize performance.
Ulasan pelanggan
5 | 0 % | |
4 | 100 % | |
3 | 0 % | |
2 | 0 % | |
1 | 0 % |


![Logo "[Hamster-Coder] Moving Average MTF"](https://cdn.ctrader.com/image/webp/b11b98b1-194d-4b8e-b00e-d611826ad159_31226)

