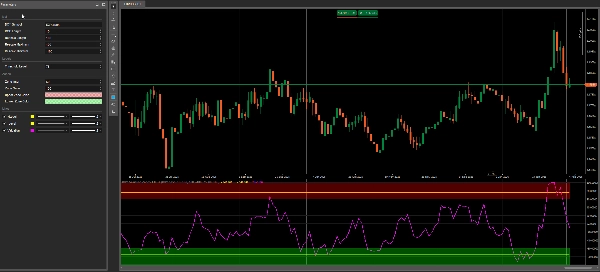
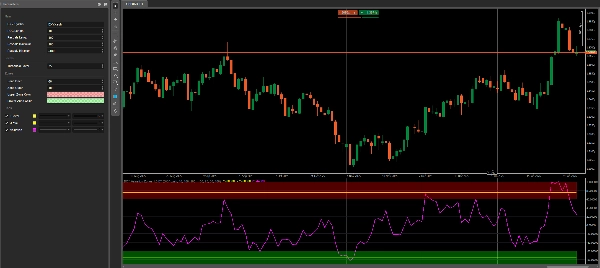
「DXY Valuation Zones 1.0 BT」ロゴ
DXY Valuation Zones 1.0 BT
「DXY Valuation Zones 1.0 BT」アップロード画像
33
販売
732
無料インストール

DXY Valuation Zones 1.0 BT shows a clean DXY-relative valuation line for your chart symbol and highlights two simple context areas: an Over Zone and an Under Zone.
It’s built as a Daily (D1) context filter — no clutter, just clear zones + a configurable ±Threshold level.

All zone colors use the native cTrader color picker, so you can control transparency directly via the opacity slider inside the palette.

Recommended Use (Best on Daily)

This indicator works best on USD-related pairs, because DXY represents broad USD strength.

Examples:

  • XXXUSD: EURUSD, GBPUSD, AUDUSD, NZDUSD
  • USDXXX: USDJPY, USDCAD, USDCHF

Quick Start (recommended defaults)

  • Timeframe: Daily (D1)
  • Over Zone: +70 … +100
  • Under Zone: -70 … -100
  • Threshold: ±75 (adjustable)
  • DXY Symbol: DXY.cash (or your broker’s DXY name)


How it works (simple)

  1. Calculates ROC (percent change) for your chart symbol
  2. Calculates the same ROC for DXY
  3. Uses the difference (Symbol ROC – DXY ROC)
  4. Rescales the result into a stable -100 … +100 range


How to read it

  • Valuation > +Threshold → stretched / “Over” context
  • Valuation < -Threshold → stretched / “Under” context
  • In-between → neutral context

Use it as a bias & location filter, not as a standalone entry signal.


Important (Broker requirement)

This indicator requires a broker-provided DXY symbol (example: DXY.cash).
Tested on FTMO (availability and naming may vary by broker feed).
If your broker uses a different name, just change the DXY Symbol pa

Indicator profile
0.0
レビュー: 0
カスタマーレビュー
この商品にはまだレビューがありません。お使いになったことがある方は、ぜひレビューをお願いします。
Prop
Forex
Signal
Products available through cTrader Store, including trading bots, indicators and plugins, are provided by third-party developers and made available for informational and technical access purposes only. cTrader Store is not a broker and does not provide investment advice, personal recommendations or any guarantee of future performance.

この作成者の他の商品

「Market Session BT」ロゴ
4.3
(3)
無料
Market Session BT
Half Trend BT by BullittTraders
「Camarilla 1.5 BT」ロゴ
5.0
(2)
無料
Camarilla by Bullitt Traders — a precise, non-repainting pivot indicator for cTrader.
HMA MTF 2.0 (Multi-Timeframe )
Bar Time Timeframe / Renko
Price Change Bundle 3-in-1 Levels • Bars • Histogram. Secret of Price Change
Belkhayate PRC (Polynomial Regression Channel)
Half Trend Cloud

これも好きかも

The Fibonacci Automated Levels Indicator is a smart trading tool that automatically detects the most recent market.
📊 ZigZag Liquidity Projection: Predict bounces/breaks using pivots, ATR & volume.
Displays a dynamic stop loss line based on the Average True Range (ATR), helping traders visualize volatility-based risk
Volume Profile Supply Demand
「ZScore」ロゴ
5.0
(2)
無料
Z-Score measures price deviation from its average, helping identify extremes, trends, and trading opportunities ........
🎯 Automatically identify significant breakouts from price consolidation zones.
Drag MA to any swing point — MA anchors and recalculates instantly. Not period-based. Structural.
Block Liquidity,indicator.Block Order, Liquids Stops, Signal Sentiment,signal correctio.
Un indicateur tout-en-un intelligent qui détecte la tendance, donne un avis clair (achat/vente)
Stochastic Confluence Pro (RSI + Divergence)
Allow trader to draw multi trendlines in different timeframes on one chart,Give trader an overview of the current market
🎯Generate precise BUY/SELL signals. 📈🎯 Tracks trends with colored candles & clouds.
Institutional Supply & Demand Mapping Across Five Timeframes — Automatically.
🚀 TrendHeikinMultiMA: Advanced trend detection using Heikin-Ashi smoothing & MAs! Eliminates noise, confirms real trend
Designed to follow price more naturally, adjusting automatically to market speed, to reduce lag and false signals.
Area of Interest with the power of AI to detect the market interest.
Smart ICT Concepts indicator from TV: combining FVGs, Liquidity, Order Blocks, and Market Structure in one tool.
The Support & Resistance Pro helps traders identify key support and resistance levels for informed trading decisions.
33
販売
732
無料インストール