
ホエールハンティングインジケーター – ブカリアカデミー
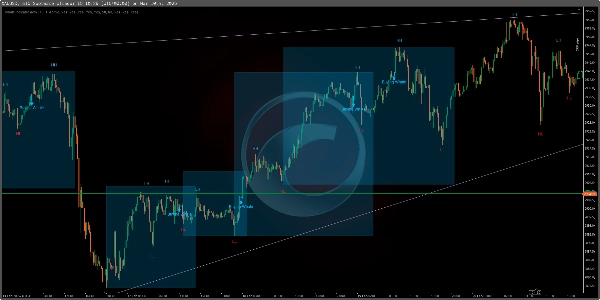
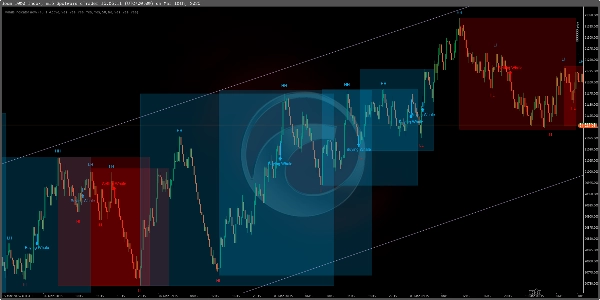
この ホエールハンティングインジケーター は、特に ブーム&クラッシュ指数およびボラティリティ指数 向けに設計された強力な トレーディングツールです。自動トレンド検出機能(Auto Trend Detector)を備え、強気および弱気のトレンドを検出し、市場構造のポイント(HH、HL、LH、LL)をマークし、トレーダーが情報に基づいた意思決定を行うのに役立つ高精度の買いおよび売りシグナルを提供します。
主な特徴:
✅ 自動トレンド検出機能 – 市場のトレンドを自動的に識別し、手動分析の必要性を減らします。
✅ ブーム&クラッシュおよびボラティリティ指数向けに設計 – これらの合成市場での取引に最適化されています。
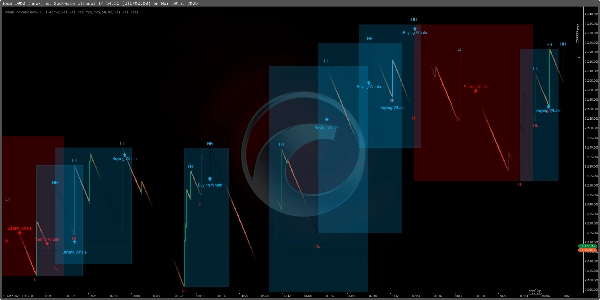
✅ ブーム&クラッシュのスパイク検出(M1タイムフレーム) – M1でのスパイクを特定し、トレーダーが急速な価格変動を捉えるのに役立ちます。
✅ M15でのトレンド識別 – 通常のトレンド分析と構造化された取引セットアップにM15を効果的に使用します。
✅ 市場構造分析 – より良いトレンド理解のために、高値更新(HH)、安値更新(HL)、高値切り下げ(LH)、安値切り下げ(LL)を表示します。
✅ ホエールエントリーシグナル – 正確な取引エントリのために、「買いホエール」と「売りホエール」のポイントを強調表示します。
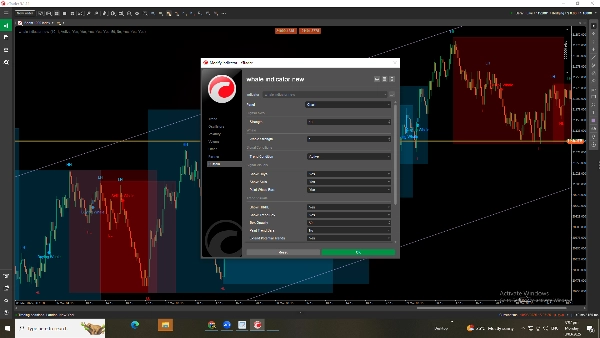
✅ 完全にカスタマイズ可能な設定 – ホエールの強さ、シグナル感度、トレンド条件を調整して取引アプローチを洗練できます。
✅ 機能の有効化/無効化 – 必要に応じてトレンドボックス、市場構造ポイント、買い/売りシグナルを切り替えられます。
ホエールハンティングインジケーターの使い方?
1️⃣ 自動トレンド検出 – インジケーターにトレンド方向を自動的に識別させます。
2️⃣ M1でのブーム&クラッシュスパイクの取引 – M1のシグナルを探して価格スパイクを効率的に捉えます。
3️⃣ M15での市場トレンド分析 – M15を使用して構造化されたトレンド分析と取引確認を行います。
4️⃣ 市場構造に従う – HH、HL、LH、LLを使ってトレンドの方向と強さを理解します。
5️⃣ ホエールシグナルを探す – 「買いホエール」または「売りホエール」のポイントで取引に入ります。
6️⃣ 精度のためにカスタマイズ – ホエールの強さとシグナル感度を調整して結果を最適化します。
7️⃣ 機能の有効化/無効化 – 戦略に応じてトレンド条件と構造設定を変更します。
このインジケーターは ブーム&クラッシュおよびボラティリティ指数に最適で、高確率の取引機会を精度と効率で提供します。🚀
5 | 33 % | |
4 | 67 % | |
3 | 0 % | |
2 | 0 % | |
1 | 0 % |


