
Engulfing Pattern Indicator
インジケーター
463 ダウンロード数
バージョン 1.0、Mar 2025
Windows、Mac
4.0
レビュー: 1
説明
包み足パターンインジケーター – 説明
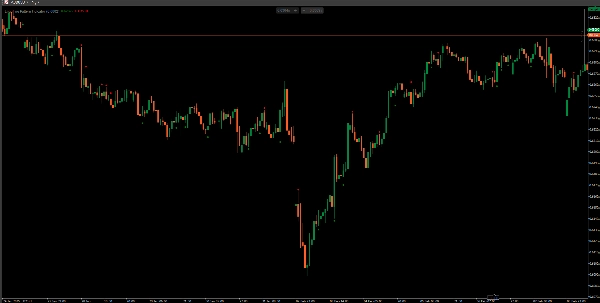
この 包み足パターンインジケーター は、強気および弱気の包み足ローソク足パターン を検出し、潜在的なトレンドの反転を示します。
仕組み
🔍 強気の包み足:
- 前のローソク足が弱気である(終値 < 始値)。
- 現在のローソク足が強気である(終値 > 始値)。
- 強気のローソク足が前のローソク足の実体を包み込む(始値 < 前の終値 & 終値 > 前の始値)。
- 緑のマーカー がパターンの下に表示されます。
🔍 弱気の包み足:
- 前のローソク足が強気である(終値 > 始値)。
- 現在のローソク足が弱気である(終値 < 始値)。
- 弱気のローソク足が前のローソク足の実体を包み込む(始値 > 前の終値 & 終値 < 前の始値)。
- 赤のマーカー がパターンの上に表示されます。
主な特徴
✅ 強力な反転シグナル を価格動向から識別します。
✅ すべての時間枠と市場(外国為替、株式、暗号通貨)で機能します。
✅ トレーダーが重要なレベルで高確率のトレードセットアップ を見つけるのに役立ちます。
📌 最適な使い方: サポート/レジスタンスおよびトレンド分析と組み合わせて、より高い精度を実現しましょう! 🚀
概要
AIによる概要
The Engulfing Pattern Indicator identifies bullish and bearish engulfing candlestick patterns, which are signals of potential trend reversals in price action. It works by detecting when a current candle fully engulfs the body of the previous candle under specific conditions:
- Bullish Engulfing occurs when a bearish candle is followed by a larger bullish candle that engulfs the previous candle’s body. A green marker is plotted below this pattern.
- Bearish Engulfing occurs when a bullish candle is followed by a larger bearish candle that engulfs the previous candle’s body. A red marker is plotted above this pattern.
This indicator operates across all timeframes and markets, including Forex, Stocks, and Crypto. It helps traders identify strong reversal signals and high-probability trade setups at key levels. For improved accuracy, it is recommended to use this indicator in combination with support/resistance and trend analysis.
インジケーターのプロフィール
カスタマーレビュー
4.0
レビュー: 1
5 | 0 % | |
4 | 100 % | |
3 | 0 % | |
2 | 0 % | |
1 | 0 % |
カスタマーレビュー
August 12, 2025
Pros: Accurate detection of bullish and bearish engulfing patterns, customizable settings, stable performance. Cons: No alerts, no MTF mode, no trade statistics.
ディスカッション
よくあるご質問
Forex
Signal
Crypto
Stocks
cTrader Storeで入手可能な取引ボット、インジケーター、プラグインなどの商品は、第三者の開発者が提供するものであり、情報と技術の取得のみを目的としてご利用いただけます。cTrader Storeはブローカーではなく、投資助言や個人的な推奨を行うことも、将来のパフォーマンスを保証することもありません。


価格
登録日 21/02/2025
466.3M
取引数量
180.83K
獲得pips
22
販売
6.92K
無料インストール