説明
VPDインジケーター
VPDは、任意のForexシンボルで日中取引を行う方に推奨されるインジケーターです。
それはいくつかのパラメーターの組み合わせで構成されており、それらは以下の通りです:
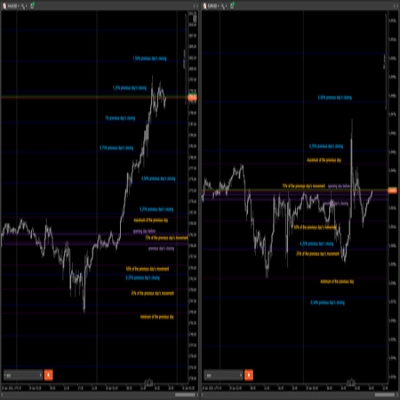
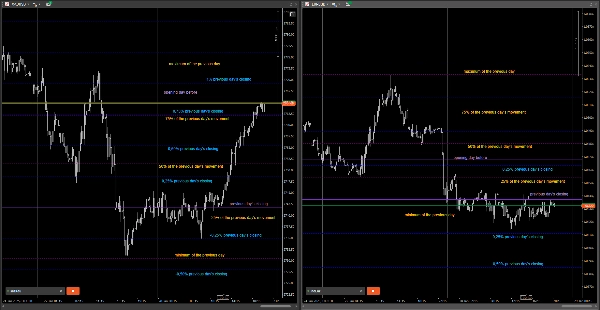
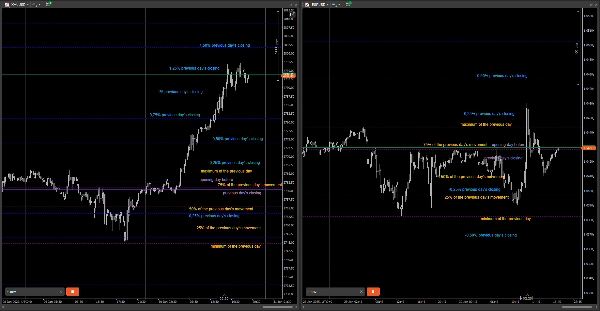
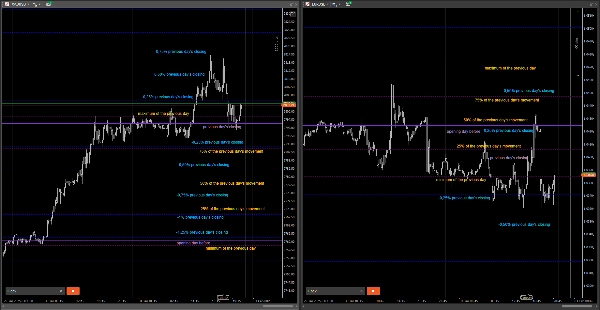
• 前日の始値と終値;
• 前日の最高値と最安値、および前日の全体の動きの中間パーセンテージ25%、50%、75%(設定可能)の変動;
• 前日の終値からの価格変動のパーセンテージ -2%、-1.75%、-1.50% ... +1.50%、+1.75%、+2%(設定可能)。
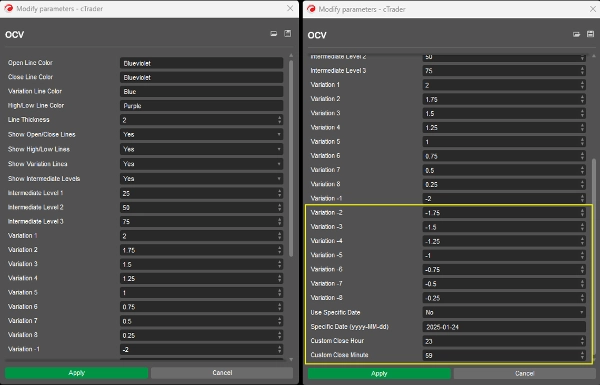
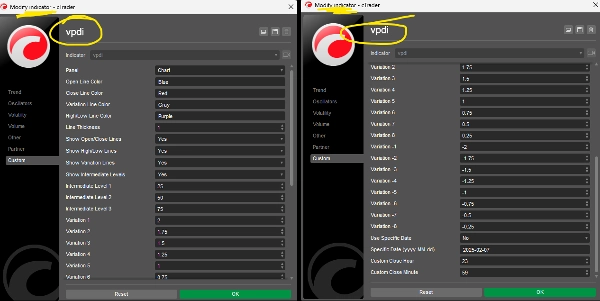
色、線の太さ、パーセンテージを変更したり、以下の例のようにグラフに表示するものを選択したりできます。
特定の期間に表示したい場合は、日付と時間を指定できます。
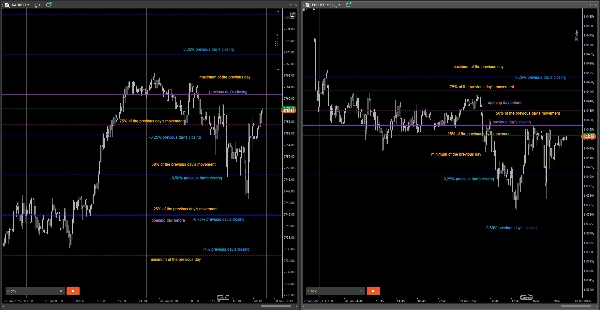
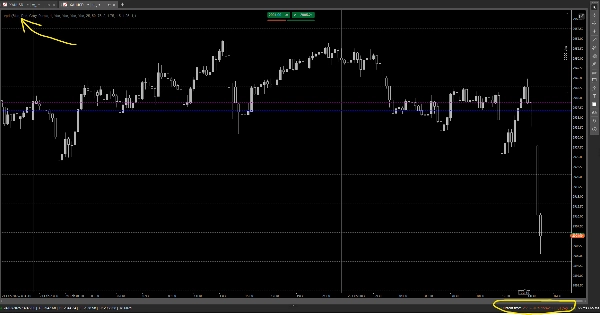
(印刷物ではcbotとなっていますが、その後インジケーターに変更しました。)
本日の日付(2025年2月25日)でインジケーターをチャートに表示したスクリーンショットを更新しました。
連絡先メール:ortsac.nanido@gmail.com
概要
インジケーターのプロフィール
カスタマーレビュー
0.0
レビュー: 0
カスタマーレビュー
この商品にはまだレビューがありません。お使いになったことがある方は、ぜひレビューをお願いします。
ディスカッション
よくあるご質問
Forex
cTrader Storeで入手可能な取引ボット、インジケーター、プラグインなどの商品は、第三者の開発者が提供するものであり、情報と技術の取得のみを目的としてご利用いただけます。cTrader Storeはブローカーではなく、投資助言や個人的な推奨を行うことも、将来のパフォーマンスを保証することもありません。


![「[Hamster-Coder] Moving Average MTF」ロゴ](https://cdn.ctrader.com/image/webp/b11b98b1-194d-4b8e-b00e-d611826ad159_31226)


価格
登録日 01/01/2025