
Multi-Timeframe Bias Assistant
インジケーター
バージョン 1.0、Jun 2026
Windows、Mac
説明
マルチタイムフレーム期間オーバーレイおよびMTFバイアスインジケーターの概要
MTF期間オーバーレイおよびバイアスアシスタントは、cTrader向けに構築された包括的なマルチタイムフレーム(MTF)オーバーレイインジケーターです。高レベルの市場構造、セッション流動性、およびリスク管理指標を低タイムフレームの実行チャート(M1〜M15)に直接集約するよう設計されており、チャートタブを頻繁に切り替える必要を最小限に抑えます。
分析される市場データと条件
このインジケーターは、いくつかの主要なプライスアクション指標における合流を評価します:
- マルチタイムフレームバイアス: 日足、H4、H1、M15のタイムフレームで同時に方向性バイアス(強気、弱気、またはレンジ)を評価します。
- サプライ&デマンド(S&D): 有効なスイングポイント、インパルスムーブ、およびベースキャンドルを自動検出してサプライおよびデマンドゾーンを描画します。これらのゾーンを検証するためにフェアバリューギャップ(FVG)を積極的にフィルタリングします。
- プレミアム対ディスカウント価格設定: 日中の中間点(均衡点またはEQ)を計算し、現在のプライスアクションがプレミアム(高価)領域かディスカウント(安価)領域かを判断します。
- ボラティリティ&リスク容量: 日次平均真の範囲(ATR)を追跡し、典型的な日中の動きのどれだけが既に消費されたかを測定し、市場が疲弊している場合にトレードを避けるようにします。
視覚的要素と解釈
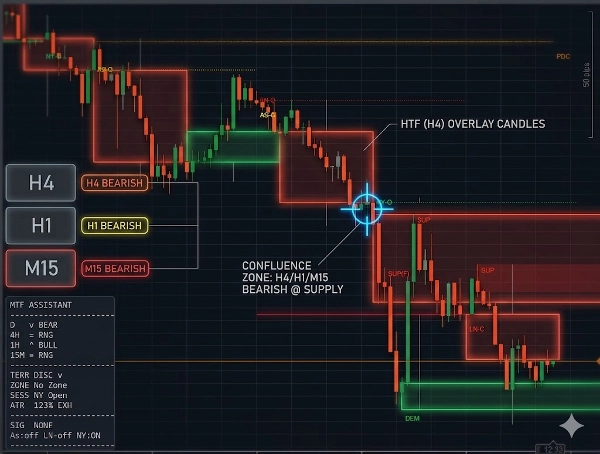
- HTFキャンドルオーバーレイ(v2.19で新登場): M1〜M15チャート上に透明で幅広い高タイムフレームキャンドル(例:H1またはH4)を直接レンダリングします。リアルタイムの「ライブ」ブロックは低タイムフレームのバーが閉じるにつれて伸び、現在のマイクロプライスアクションが高タイムフレームキャンドルをどのように形成しているかを正確に見ることができます。
- S&Dゾーンボックス: 有効なゾーンを示す視覚的な長方形。これらは動的にラベル付けされ、ゾーンが何回テストされたかを追跡します(例:「Chart DEM-F」は新しいデマンドゾーン、「DEM 1x」は再テストされたゾーン)。
- バイアステーブル: D1、H4、H1、M15のトレンドをまとめたカスタマイズ可能なカラフルなオンスクリーンダッシュボードで、市場が整合しているかどうかを即座に明確にします。
- トレードシグナル: 厳格な条件が満たされた場合に、明確な色分けされた買い/売りシグナルを表示します(例:価格がディスカウントゾーンにあり、新しいデマンドレベルに触れ、包み足またはピンバーのパターンを形成し、MTFバイアスと整合し、利用可能なATRを持つアクティブな取引セッション内にある場合)。
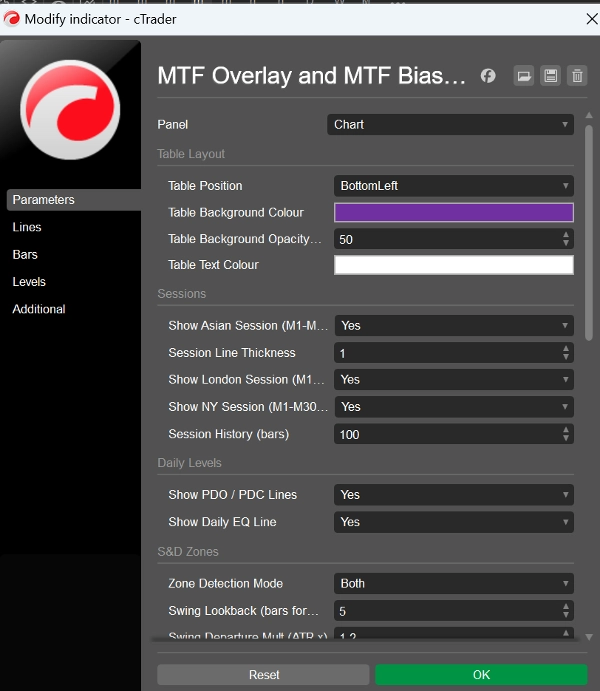
- セッション&日次レベル: アジア、ロンドン、NYセッションのオープンに垂直線を引き、前日のオープン(PDO)、前日のクローズ(PDC)、および日次均衡に水平線を引きます。
主要設定とパラメーター
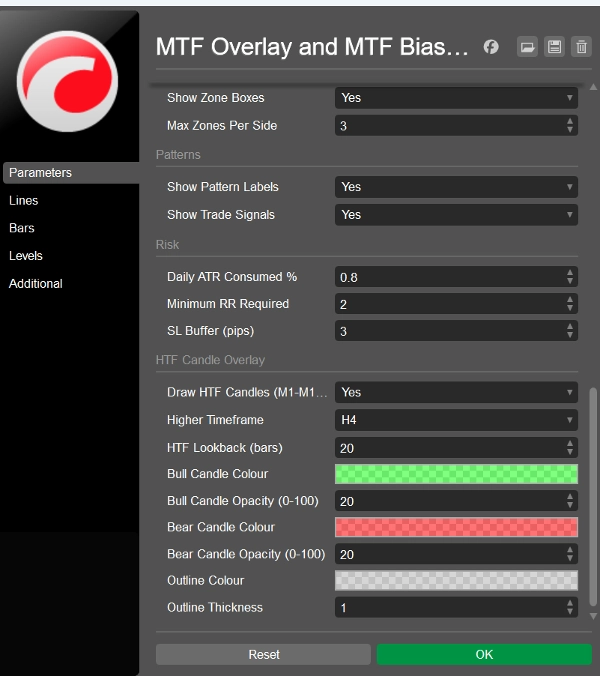
- HTFキャンドルオーバーレイ:
DrawHtfCandles、HtfTimeframe(H1/H4/D1)、およびチャートの乱雑さを防ぐための高度にカスタマイズ可能な不透明度/色設定。 - S&Dゾーン:
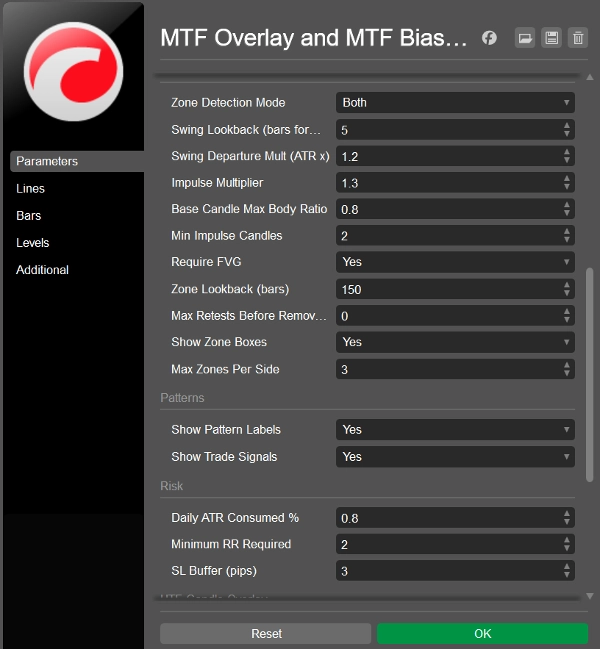
RequireFVG(厳格な構造ルールの切り替え)、Max Retests Before Remove(破損したゾーンをクリアしてチャートをクリーンに保つ)、およびImpulse Multiplier(ゾーンとして認定されるために動きがどれだけ強力でなければならないかを決定)。 - リスク管理:
Daily ATR Consumed %(例えば、日中の範囲の80%が既に達成されている場合にトレードを制限)およびMinimum RR Required(トレードパラメーターが基準となるリスク対リワード比を満たすことを保証)。
典型的な使用例とシナリオ
このツールは高確率のデイトレンド継続セットアップ向けに構築されています。
- 「整合されたプルバック」シナリオ: トレーダーはD1、H4、H1のバイアスがすべて強気であることを確認します。次にM15チャートに切り替えます。インジケーターは価格が日中の範囲の「ディスカウント」半分に落ち、新しいH1デマンドゾーンに触れていることを示します。ロンドンセッションが始まると、強気の包み足が形成されます。インジケーターはATR制限を検証し、買いシグナルを発動して高い合流エントリーを確認します。
最適な対象
- トレーダープロファイル: サプライ&デマンド手法とプライスアクションを利用するデイトレーダーおよびスキャルパー。オーダーブロック、流動性スイープ、マルチタイムフレーム整合に焦点を当てた戦略に完璧に補完します。
- 経験レベル: 中級から上級。初心者は情報の密度(FVG、プレミアム/ディスカウント、MTFバイアス)に圧倒される可能性があります。
- 特定の環境: ゴールド(XAU/USD)やボラティリティの高い指数で取引を行うトレーダー、特に独自のトレーディングファーム評価の厳格なドローダウンパラメーター内で運用するトレーダーに適しています。組み込みのATR疲弊および最小RRフィルターは資本保全に不可欠です。
重要な制限事項と使用上の注意
- チャートの特異性: HTFキャンドルオーバーレイおよび特定のS&DゾーンはM1〜M15チャートに厳密に限定されています。M30チャート以上にインジケーターを適用すると、視覚的な歪みを防ぐためにオーバーレイが抑制されます。
- 遅延バイアス: 高タイムフレームバイアス(D1、H4)はクローズしたキャンドルに依存しています。非常にボラティリティが高いかニュース主導の環境では、バイアスが反転するまで時間がかかる場合があり、インジケーターは大きなキャンドルが閉じるまで積極的な反転を「レンジ」とラベル付けすることがあります。
- 自動ボットではない: トレードシグナルは高合流条件のアラートであり、実行を保証するものではありません。基本的な要因やマクロ経済の文脈を評価するための裁量が必要です。
概要
AIによる概要
The Multi-Timeframe Bias Assistant is a cTrader indicator designed to consolidate multi-timeframe market analysis onto lower-timeframe charts (M1–M15). It evaluates directional bias simultaneously across Daily, H4, H1, and M15 timeframes, providing a comprehensive view of market trends. The indicator automatically identifies key Supply and Demand zones by detecting swing points, impulsive moves, and base candles, validated through Fair Value Gaps (FVGs). It calculates the daily midpoint to classify price action as Premium or Discount and tracks daily volatility via the Average True Range (ATR) to assess risk capacity.
Visual features include transparent higher timeframe candle overlays, dynamic Supply and Demand zone boxes with retest counts, and a color-coded Bias Table summarizing trend alignment. Trade signals appear when multiple conditions align, such as price in Discount zones, fresh Demand levels, specific candlestick patterns, and ATR limits within active trading sessions. The indicator also marks major session opens and daily reference levels.
Settings allow customization of overlays, zone strictness, retest limits, and risk parameters like ATR consumption and minimum risk-to-reward ratios. It is suited for intermediate to advanced intraday traders focusing on Supply and Demand, order blocks, liquidity sweeps, and multi-timeframe alignment, particularly on instruments like Gold (XAU/USD) and volatile indices. The tool supports visualization and level-touch signals based on bar and tick data.
インジケーターのプロフィール
インジケーターのカテゴリー
市場構造(SMC)
出力の種類
ビジュアル表示
データ要件
バーのみ
ティックデータ
サポート対象のシグナル
反転
ラインタッチ
カスタマーレビュー
0.0
レビュー: 0
カスタマーレビュー
この商品にはまだレビューがありません。お使いになったことがある方は、ぜひレビューをお願いします。
ディスカッション
よくあるご質問
Fair Value Gap
Liquidity Sweep
Order Block
Market Structure
Supply & Demand
cTrader Storeで入手可能な取引ボット、インジケーター、プラグインなどの商品は、第三者の開発者が提供するものであり、情報と技術の取得のみを目的としてご利用いただけます。cTrader Storeはブローカーではなく、投資助言や個人的な推奨を行うことも、将来のパフォーマンスを保証することもありません。
この作成者の他の商品


価格
99.84M
取引数量
16.78K
獲得pips