present
Đăng ký và nhận ưu đãi $50 cho lần mua đầu tiên
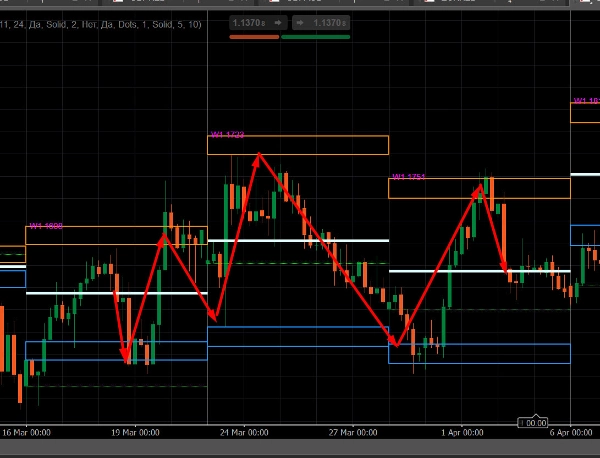
Trading product for MyZtrade W1 MN zones Chỉ báo EMA Supertrend, image 1
MyZtrade W1 MN zones
Chỉ báo
Phiên bản 1.0, Aug 2026
Windows, Mac
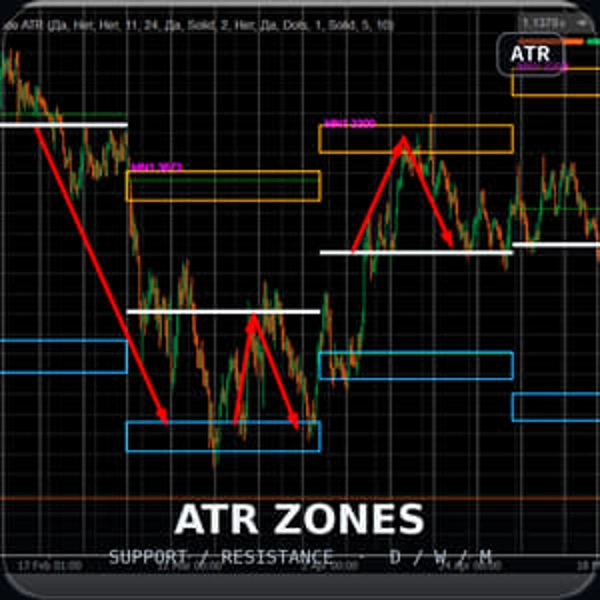
Trading product for MyZtrade W1 MN zones Chỉ báo EMA Supertrend, image 2
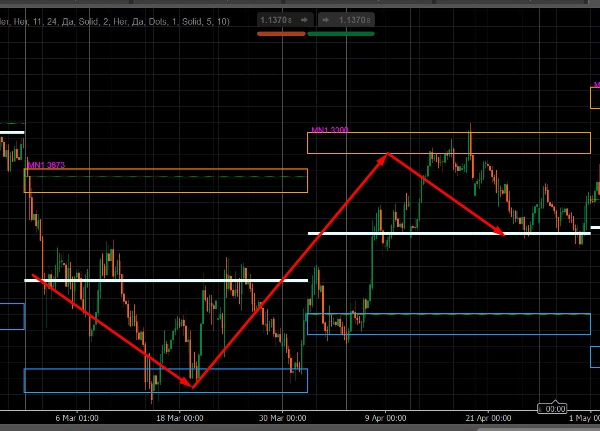
Trading product for MyZtrade W1 MN zones Chỉ báo EMA Supertrend, image 3
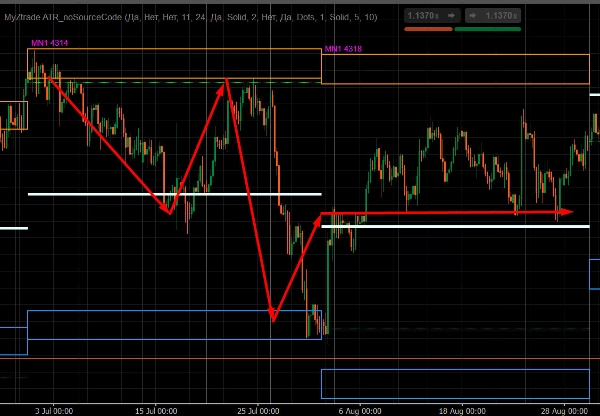
Trading product for MyZtrade W1 MN zones Chỉ báo EMA Supertrend, image 4
Trading product for MyZtrade W1 MN zones Chỉ báo EMA Supertrend, image 5
Kể từ 28/06/2025

Mô tả

MyZtrade MTF ATR Zones — Vùng Hỗ Trợ & Kháng Cự Dựa Trên ATR Đa Khung Thời Gian

Chỉ báo này vẽ các vùng đảo chiều tiềm năng (hỗ trợ/kháng cự) trên biểu đồ dựa trên phạm vi Trung bình Cao–Thấp của các thanh khung thời gian cao hơn — Hàng Tháng, Hàng Tuần và Hàng Ngày — độc lập với khung thời gian của biểu đồ.


Nó Làm Gì


Đối với mỗi khung thời gian được bật (Hàng Tháng / Hàng Tuần / Hàng Ngày), chỉ báo:


• Tính toán phạm vi trung bình (Cao–Thấp) trên một số lượng thanh gần đây nhất trong khung thời gian đó (mặc định: 11 thanh)


• Vẽ các vùng kháng cự và hỗ trợ hình chữ nhật trên biểu đồ, lệch khỏi mức cao/thấp của mỗi thanh theo giá trị của phạm vi trung bình này


• Gán nhãn cho mỗi vùng với giá trị biến động tính bằng điểm và tiền tố khung thời gian (ví dụ, MN1 2696, W1 1180, D1 340) — hữu ích khi nhiều khung thời gian được bật cùng lúc


• Ngoài ra vẽ đường giá mở cửa của thanh và đường trung vị bên trong vùng


• Theo dõi riêng thanh hiện tại (chưa đóng) — vùng của nó di chuyển theo thời gian thực khi thanh phát triển


Các Tính Năng Chính


• Nhiều khung thời gian cùng lúc — Hàng Tháng, Hàng Tuần và Hàng Ngày có thể được bật độc lập với nhau


• Không bị ràng buộc với khung thời gian của biểu đồ — bạn có thể xem các vùng hàng tháng trên biểu đồ theo giờ, v.v.


• Giao diện hoàn toàn tùy chỉnh — màu sắc, độ dày và kiểu đường, tô/vẽ viền vùng, kích thước chữ


• Phục vụ như một hướng dẫn trực quan; không tạo tín hiệu giao dịch và không chứa logic vào/ra

Tóm tắt

Tóm tắt AI
MyZtrade W1 MN zones is a multi-timeframe indicator that identifies potential reversal zones of support and resistance on trading charts. It calculates the average range (High–Low) over a configurable number of recent bars (default 11) for selected higher timeframes—Monthly, Weekly, and Daily—regardless of the chart’s current timeframe. The indicator then plots rectangular zones offset from each bar’s high and low by this average range, visually marking areas where price reversals may occur.

Each zone is labeled with its volatility value in points and the corresponding timeframe prefix (e.g., MN1, W1, D1) to distinguish multiple enabled timeframes. Additional visual elements include the bar’s opening price line and a median line within each zone. The indicator also tracks the current, developing bar in real time, updating its zone dynamically.

Key features include simultaneous display of multiple timeframes, full customization of visual appearance (colors, line styles, text size), and independence from the chart’s timeframe, allowing monthly zones to be viewed on intraday charts. This tool serves as a visual guide for support and resistance levels based on volatility but does not provide trading signals or entry/exit logic.
Hồ sơ chỉ báo

Đánh giá của khách hàng

0.0
Đánh giá: 0
Đánh giá của khách hàng
Sản phẩm này chưa có đánh giá nào. Bạn đã dùng thử chưa? Hãy là người đầu tiên chia sẻ với mọi người!

Thảo luận

Câu hỏi thường gặp

EMA
Supertrend
Supply & Demand
ATR
Moving Average
VWAP
Support & Resistance
Các sản phẩm có sẵn trên cTrader Store, bao gồm bot giao dịch, chỉ báo và plugin, được cung cấp bởi các nhà phát triển bên thứ ba và chỉ nhằm mục đích cung cấp thông tin và tiếp cận kỹ thuật. cTrader Store không phải là nhà môi giới và không cung cấp lời khuyên đầu tư, khuyến nghị cá nhân hay bất kỳ đảm bảo nào về hiệu suất trong tương lai.

Sản phẩm khác của tác giả này

Chỉ báo
Volume
Key Levels
+4
Margin Zones its CME-based support/resistance levels from price extremes, helps traders spot entries and exits NKZ zones
Chỉ báo
Channel
Fibonacci
+5
Market maker levels from key price extremes — catch major reversals and corrections in one click. ver1.2
Chỉ báo
BOS
CHOCH
+5
MyZTrade High TF candle is a multi-timeframe visualisation tool that overlays completed higher-timeframe candles.

Bạn cũng có thể thích

Chỉ báo
Pin Bar
Inducement
+5
Institutional Nasdaq Session Liquidity Map with Live Point HUD, Sweep Alerts & Interactive Playbook.
Chỉ báo
Signal
Fractal Arrow Buy and Sell Indicator
Chỉ báo
Prop
Forex
+13
🎯Automatically detects and visualizes classical chart patterns using multi-timeframe swing point analysis.
Chỉ báo
ATR
RSI
+17
Turn data into precision trades with AlphaTrend Pro Max — advanced trend, signal & structure analysis in one.
Chỉ báo
ATR
Volume
+5
Order blocks with measured hold-rate stats and confidence scoring — not just zones on a chart.
Chỉ báo
BOS
MSS
+2
Stay ahead with a real-time countdown to candle closes on all key timeframes: 5m, 15m, 30m, 1H, 4H, and Daily.
Chỉ báo
Prop
Forex
+9
Trend Sniper — session-based tool highlighting live session ranges and adaptive Custom line.
Chỉ báo
BOS
Volume
+5
20/40/60-day IPDA lookback ranges, Premium/Discount/Equilibrium zones, and quarterly shift alerts — anchored to true dai
Chỉ báo
The Break of Structure (BoSCHoCh) Indicator is a smart market structure tool designed to help traders easily spot trend.
Chỉ báo
Inside Bar
Save time by lighting a candle to look within yourself in another temporality
Chỉ báo
ATR
Channel
Reversal Trap Probability Bands plots a dynamic volatility envelope around price & automatically detects "trap" reversal
Chỉ báo
ATR
Forex
+2
Trade fearlessly: auto-adjusts order blocks, manages risks, and ensures precision. Was Free for early users now -80%
Chỉ báo
ATR
RSI
+8
Multi-timeframe market-state dashboard: Score (-100..+100) + UP/NEUT/DN per TF, with optional closed-candle arrows.
Chỉ báo
Breakout
FlexSR auto‑detects pivot highs/lows to plot dynamic support & resistance lines Features customizable styling and option
Chỉ báo
EMA
A visual signal backtester that simulates trades directly on your chart and scores strategy performance.
Chỉ báo
ATR
Channel
+1
Bollinger Bands Advanced Squeeze & Breakout System, Real-Time On-Chart Dashboard, Auto-Squeeze Detector, Dual-Band Cloud
Chỉ báo
ATR
Volume
+4
Advanced broker tick-volume profile with estimated POC, VAH/VAL, estimated HVN/LVN and session/lookback context.
Logo "heatmap kopie"
Hàng đầu
4.2
(4)
$19
/
$29
Chỉ báo
AI
SMC
+13
Dynamic Liquidity Depth exposes hidden volume

Giá

Kể từ 28/06/2025