
PrevDayProjection
Indicador
217 transferências
Versão 1.0, Sep 2025
Windows, Mac
Descrição
Níveis de Projeção do Dia Anterior
Desbloqueie negociações precisas com projeções dinâmicas de Fibonacci baseadas na ação de preço de ontem.
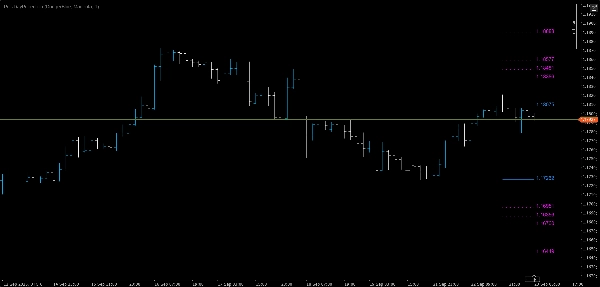
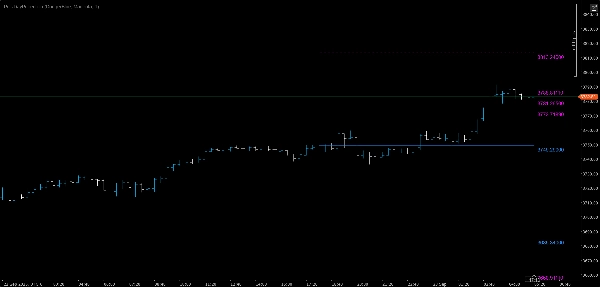
Este indicador calcula automaticamente o máximo e mínimo do dia anterior, determina o intervalo, e então projeta níveis de Fibonacci tanto acima quanto abaixo desse intervalo — fornecendo pontos de referência instantâneos para potenciais zonas de suporte, resistência e rompimento.
Principais Características
- 📅 Detecção automática do máximo e mínimo do dia anterior
- 📏 Projeções de Fibonacci baseadas no intervalo nos níveis de 38,2%, 50%, 61,8% e 100%
- 🔼 Acima do máximo anterior: Quatro níveis de Fibonacci para alvos de continuação de alta
- 🔽 Abaixo do mínimo anterior: Quatro níveis de Fibonacci para alvos de continuação de baixa
- 🎯 Linhas apenas no segmento começando a partir da primeira barra de hoje — sem desordem no gráfico
- 🏷 Etiquetas de preço na borda direita para referência rápida e visual
- 🎨 Cores e espessura de linha personalizáveis para combinar com o estilo do seu gráfico
Por Que os Traders Gostam
- Roteiro intradiário claro: Saiba exatamente onde estão os níveis-chave antes do início da sessão.
- Análise em duas direções: Planeje movimentos tanto de alta quanto de baixa.
- Automação que economiza tempo: Sem necessidade de desenho manual ou recálculo.
- Funciona em qualquer intervalo de tempo: Desde scalping até swing trading.
Perfeito Para
- Day traders buscando alvos precisos de rompimento
- Swing traders identificando zonas-chave de retração
- Qualquer pessoa que use níveis de Fibonacci como parte de sua estratégia
💡 Dica: Combine este indicador com suas ferramentas favoritas de momentum ou volume para confirmar entradas e saídas em torno desses níveis projetados.
Resumo
Resumo de IA
PrevDayProjection is a technical indicator designed for trading platforms that automatically calculates the previous trading day’s high and low prices, determines the range, and projects Fibonacci levels based on that range. It generates key Fibonacci retracement and extension levels at 38.2%, 50%, 61.8%, and 100% both above the previous high and below the previous low. These levels serve as potential support, resistance, and breakout zones.
The indicator displays segment-only lines starting from the current day’s first bar to avoid chart clutter and includes price labels at the right edge for quick reference. Users can customize colors and line thickness to fit their chart style. It supports any timeframe, making it suitable for scalping, day trading, and swing trading.
PrevDayProjection is applicable across multiple markets including Forex, Indices, Commodities, and Crypto, with specific tags indicating symbols like EURUSD, XAUUSD (gold), and NAS100. It provides traders with a clear intraday roadmap and dual-direction analysis to plan for both bullish and bearish moves. The tool automates manual calculations, saving time and enhancing precision in identifying breakout targets and retracement zones.
Perfil do indicador
Avaliações de clientes
0.0
Avaliações: 0
Avaliações de clientes
Ainda não há avaliações para este produto. Já o experimentou? Seja o primeiro a contar a outras pessoas!
Conversa
Perguntas frequentes
Forex
Indices
EURUSD
Commodities
Crypto
XAUUSD
NAS100
Os produtos disponíveis através da cTrader Store, incluindo bots de negociação, indicadores e plugins, são fornecidos por programadores terceiros e são disponibilizados apenas para fins informativos e de acesso técnico. A cTrader Store não é um corretor e não fornece aconselhamento em matéria de investimento, recomendações pessoais ou qualquer garantia de desempenho no futuro.


Também poderá gostar de


Preço
26
Vendas
2.14K
Instalações gratuitas