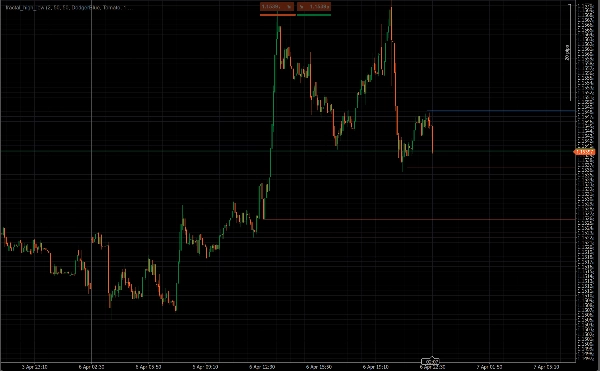
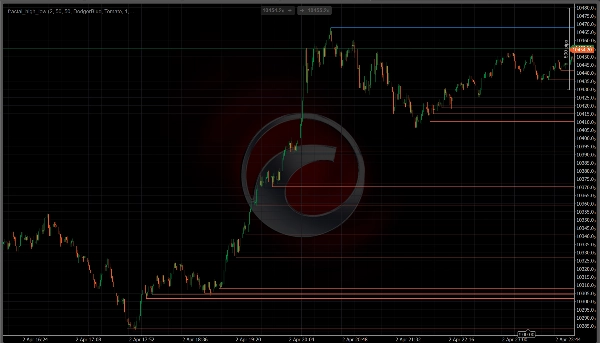
Описание
Если вы торгуете по ценовому действию, вы уже знаете, что самые
важные уровни на любом графике — это фрактальные максимумы и минимумы —
точки разворота, где цена отталкивалась, разворачивалась или пробивала
структуру. Frac High Low Lines находит эти точки для вас
и автоматически их рисует, чтобы вы могли полностью сосредоточиться на
чтении цены, а не на управлении рисунками.
──────────────────────────────────────────────────────────
КАК ЭТО РАБОТАЕТ
──────────────────────────────────────────────────────────
Индикатор использует классическую логику фракталов Уильямса для подтверждения
точек поворота. Фрактальный максимум считается действительным только тогда, когда его максимум
строго выше окружающих баров с обеих сторон. Фрактальный минимум действителен только тогда, когда его минимум строго ниже.
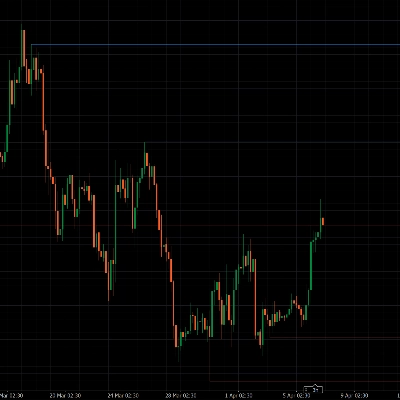
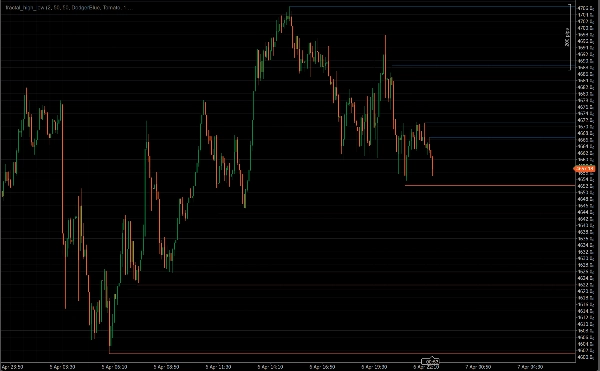
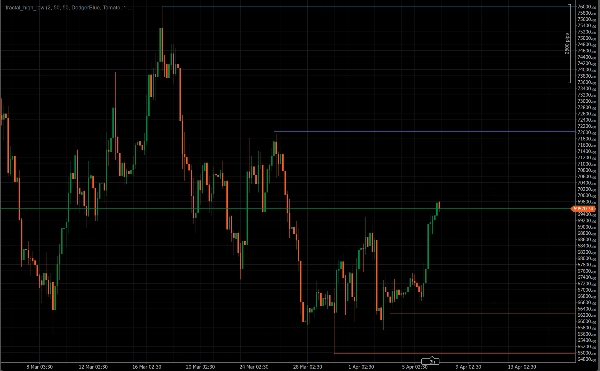
После подтверждения от этой точки поворота проводится горизонтальная линия,
которая продолжается вперед — предоставляя вам четкую визуальную ссылку
для каждого значимого структурного уровня на графике.
Без перерисовки. Фракталы подтверждаются только после закрытия достаточного количества баров
с обеих сторон, поэтому уровни никогда не появляются и не исчезают
по мере движения цены.
──────────────────────────────────────────────────────────
КЛЮЧЕВЫЕ ОСОБЕННОСТИ
──────────────────────────────────────────────────────────
• Автоматическое обнаружение фракталов — сканирует все бары при загрузке, затем
обновляется в реальном времени по мере формирования новых баров
• Настраиваемый период фрактала — используйте период 2 для каждого
незначительного колебания или увеличьте его, чтобы выделить только основные
структурные максимумы и минимумы
• Контроль максимального количества линий — независимо ограничивает, сколько
линий сопротивления и поддержки отображается одновременно, сохраняя ваш
график чистым и сосредоточенным на недавней структуре
• Удаление пробитых уровней — опционально автоматически удаляет линию,
когда цена закрывается через нее, чтобы оставались видимыми только неповрежденные уровни
• Полный визуальный контроль — настройте цвет, толщину и стиль линии
(Сплошная, Штрих, Точка) независимо для максимумов и
минимумов
• Легковесный — каждая линия рисуется один раз и никогда не перерисовывается,
поэтому производительность остается плавной даже на графиках M1 или M5
──────────────────────────────────────────────────────────
ДЛЯ КОГО ЭТО
──────────────────────────────────────────────────────────
Создан специально для трейдеров, торгующих по ценовому действию, которые используют колебательные
максимумы и минимумы для определения структуры, планирования входов в сделки,
установки стоп-лоссов и выявления потенциальных зон разворота или пробоя.
Работает с любым символом и любым таймфреймом в cTrader.
──────────────────────────────────────────────────────────
БЕСПЛАТНО — БЕЗ ПОДВОДНЫХ КАМНЕЙ
──────────────────────────────────────────────────────────
Frac High Low Lines полностью бесплатен. Установите его, добавьте
на свой график и торгуйте с более чистыми структурными уровнями с
самой первой сессии.
==========================================================
Сводка
The indicator updates in real time as new bars form and scans all bars on load. It offers configurable fractal periods to capture minor or major swings, controls to limit the number of displayed lines for clarity, and an option to automatically remove lines when price closes through them. Users can customize line color, thickness, and style independently for highs and lows. The indicator is lightweight, drawing each line once to maintain smooth performance even on low timeframes like M1 or M5.
fractal_high_low works on any symbol and timeframe within the cTrader platform and supports markets including Forex, stocks, commodities, indices, and cryptocurrencies. It aids traders in identifying market structure, planning entries, setting stops, and spotting reversal or breakout zones.





![Логотип продукта "[Stellar Strategies] Market Session Ultimate"](https://cdn.ctrader.com/image/webp/61ffd537-0125-4246-9e72-42eca1791d64_28232)