说明
BullBear Dynamics — cTrader 的趋势与动量指标
BullBear Dynamics 是一个强大且考虑波动性的 cTrader 平台指标,旨在帮助交易者检测和解读市场中多头与空头动量之间的平衡。它结合了移动平均线、ATR 标准化和动态阈值,提供一个精确且视觉直观的趋势评估工具。
方法论与内部逻辑
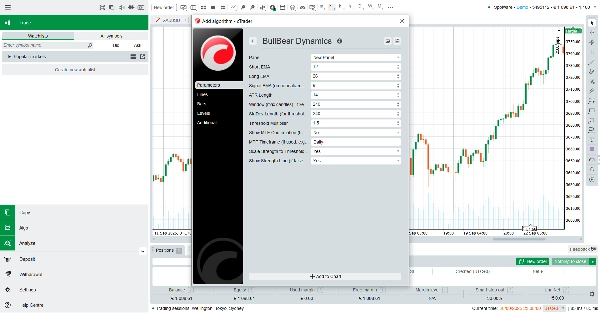
该指标计算两个指数移动平均线(EMA):一个短期 EMA 和一个长期 EMA。
然后取这两个 EMA 的差值并除以平均真实波幅(ATR)。这种标准化有助于根据当前市场波动性调整动量信号。
信号线——对标准化数值应用的 EMA——过滤噪音并平滑小幅波动。
为了区分弱势与强势走势,该工具计算回溯窗口内的滚动标准差(StdDev),并乘以一个因子以定义上下阈值。
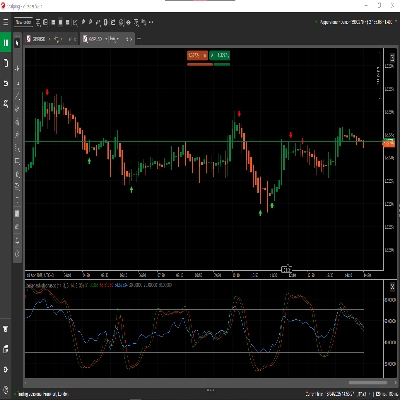
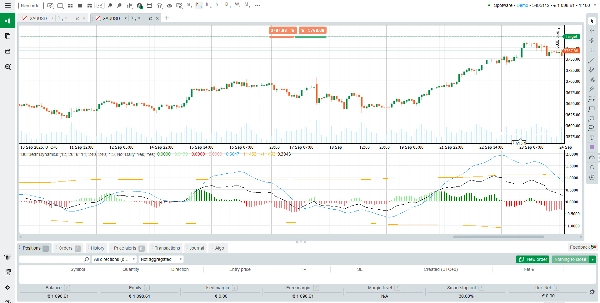
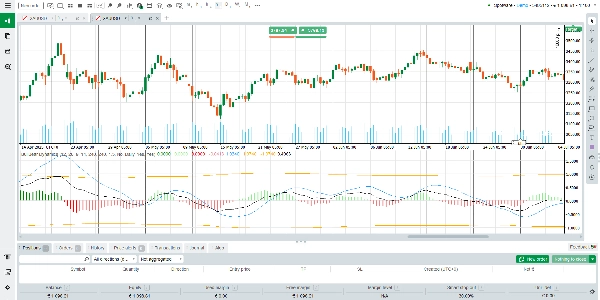
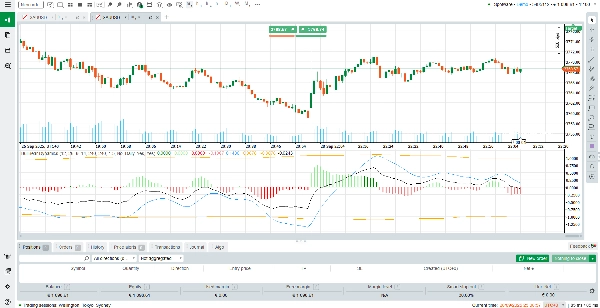
最终输出以直方图(多种颜色状态)加上信号线和阈值边界的形式可视化。
如何读取与解读输出
直方图柱(绿色 / 红色):
• 绿色表示多头动量;红色表示空头动量。
• 颜色强烈(更亮或更饱满)表示直方图超过阈值——意味着强势走势。
• 颜色较弱表示直方图保持在阈值范围内——意味着温和动量或噪音。
信号线:
• 作为参考基线。
• 当直方图向上穿越信号线时,表示多头动量可能增强。
• 当向下穿越时,表示空头动量可能增强。
阈值线(上限 & 下限):
• 这些虚线定义了重要区域。
• 直方图柱越过阈值表示强劲且高置信度的动量走势。
• 柱体保持在阈值内则暗示区间震荡或犹豫——信号可靠性较低。
情景与解读:
多头动量——绿色柱体位于信号线之上,最好也越过上阈值。
空头动量——红色柱体位于信号线之下,最好也越过下阈值。
中性 / 区间震荡——柱体在阈值内波动,颜色可能交替,振幅较小。
动量转变或反转——直方图穿越信号线,伴随颜色变化;若同时突破阈值,则信号更可靠。
使用建议与最佳实践
将 BullBear Dynamics 与其他工具(趋势过滤器、支撑/阻力、形态分析)结合使用以确认信号。
在低波动期解读信号时要谨慎,当直方图柱保持在阈值内时尤其如此。
优先考虑直方图穿越信号线并突破阈值的信号。
在低时间框架信号操作前,确认高时间框架的方向一致性。
根据不同市场(外汇、指数、商品、加密货币)需要调整参数(EMA 长度、阈值乘数、StdDev 窗口)。
主要特点与亮点
波动性自适应标准化——动量通过 ATR 缩放,使信号在不同市场环境下更可靠。
动态阈值——基于滚动标准差构建,能适应当前市场状况,有助于减少假突破。
清晰的多色直方图——视觉区分强弱动量及多头与空头。
广泛兼容——适用于 cTrader 支持的所有工具和时间框架。
免费使用——无成本提供;适合希望获得高级指标功能而无需订阅的交易者。
摘要
The output is displayed as a multi-color histogram with green bars indicating bullish momentum and red bars indicating bearish momentum. The intensity of the colors reflects the strength of the momentum relative to dynamically calculated upper and lower thresholds. The signal line serves as a baseline to identify potential momentum shifts when the histogram crosses it. Threshold lines mark zones of significant momentum moves, with bars crossing these lines signaling stronger trends.
BullBear Dynamics supports all instruments and timeframes available on cTrader, including Forex, commodities, indices, and cryptocurrencies. It is recommended to use this indicator alongside other analysis tools for confirmation and to adjust its parameters to fit different market conditions and trading styles such as scalping.
客户评价
5 | 100 % | |
4 | 0 % | |
3 | 0 % | |
2 | 0 % | |
1 | 0 % |