Descripción
Fuerza del Par (JPY) - Indicador de Fuerza de Moneda
📊 ¿Qué es la Fuerza del Par (JPY)?
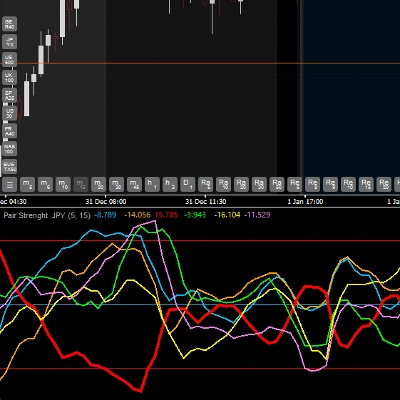
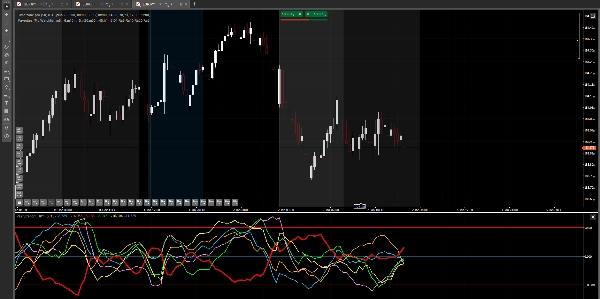
Fuerza del Par (JPY) es un indicador avanzado que analiza y compara la fuerza relativa de 6 monedas principales en tiempo real: EUR, GBP, JPY, USD, AUD y CAD. Utiliza el Índice de Fuerza Verdadera (TSI) para medir el impulso y la fuerza de cada moneda, permitiéndote identificar cuáles monedas son más fuertes o más débiles en el mercado.
🎯 Características Principales
✅ Análisis Multimoneda: Monitorea 6 monedas simultáneamente en una ventana ✅ Identificación de Tendencias: Detecta las monedas más fuertes y más débiles en el mercado ✅ Señales de Sobrecompra/Sobreventa: Niveles en 50, 0 y -50 para identificar extremos ✅ Confirmación de Operaciones: Ayuda a validar tus entradas comparando la fuerza relativa ✅ Visual y Claro: Cada moneda tiene su propio color para fácil identificación
💹 Pares Compatibles
IMPORTANTE: Este indicador analiza la fuerza de 6 monedas: EUR, GBP, JPY, USD, AUD y CAD
El indicador funciona SÓLO con pares que incluyen JPY (Yen Japonés), es decir:
- EURJPY (Euro / Yen)
- GBPJPY (Libra / Yen)
- USDJPY (Dólar / Yen)
- AUDJPY (Dólar Australiano / Yen)
- CADJPY (Dólar Canadiense / Yen)
⚠️ Tu bróker DEBE ofrecer estos 5 pares con JPY para que el indicador funcione correctamente.
No funciona con:
- Oro, plata u otros metales
- Índices bursátiles
- Criptomonedas
- Pares que no incluyen JPY (como EURUSD, GBPUSD, etc.)
Puedes aplicar el indicador en el gráfico de cualquiera de los 5 pares mencionados arriba.
📈 Cómo Usar el Indicador
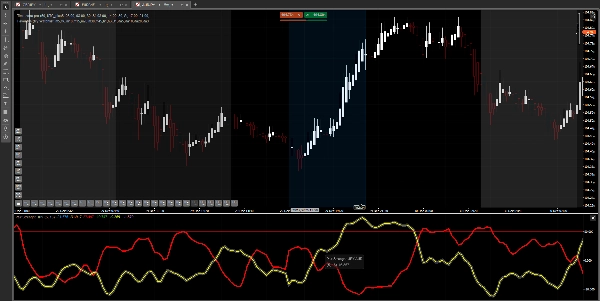
Interpretación de la Línea:
Cada línea coloreada representa la fuerza de una moneda:
- Línea hacia arriba (valores positivos): La moneda es FUERTE
- Línea hacia abajo (valores negativos): La moneda es DÉBIL
- Cruces de líneas: Cambio en la fuerza relativa entre monedas
Niveles Clave:
- Nivel 50: Zona de sobrecompra - La moneda puede estar muy fuerte y cerca de revertir
- Nivel 0: Línea neutral - Equilibrio entre fuerza y debilidad
- Nivel -50: Zona de sobreventa - La moneda puede estar muy débil y cerca de revertir
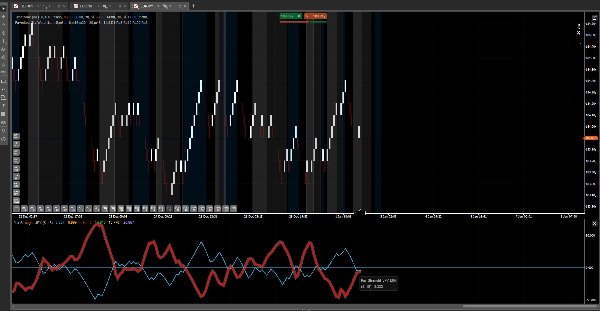
Estrategia Básica:
- Identifica la moneda MÁS FUERTE (línea más alta)
- Identifica la moneda MÁS DÉBIL (línea más baja)
- Opera el par combinando ambas (ejemplo: si EUR es fuerte y JPY es débil → compra EURJPY)
- Confirma con los niveles: Evita comprar cuando la moneda fuerte está en +50 o vender cuando la débil está en -50
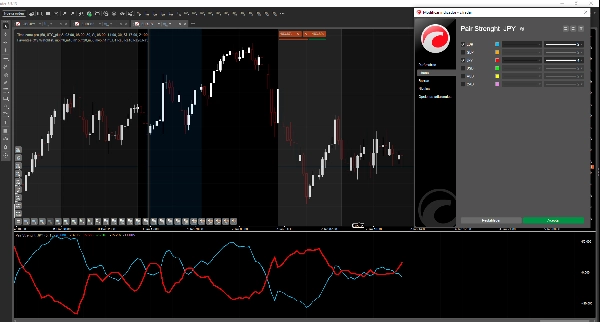
⚙️ Parámetros Ajustables
- Periodo Rápido (Por defecto: 5): Periodo rápido del TSI - valores más bajos = más sensible
- Periodo Lento (Por defecto: 15): Periodo lento del TSI - valores más altos = más suave
Los valores por defecto funcionan bien para la mayoría de las situaciones. Ajústalos según tu estilo de trading.
🔮 Actualizaciones Futuras
Estamos evaluando la posibilidad de añadir más pares de divisas (NZD, CHF, etc.) en futuras versiones, dependiendo de la respuesta y comentarios de los usuarios. Sin embargo, esto no está garantizado y dependerá del rendimiento del indicador y la demanda del mercado.
💡 Consejos de Uso
✓ Úsalo junto con tu estrategia principal, no como un sistema independiente ✓ Combínalo con análisis de acción del precio y niveles de soporte/resistencia ✓ Practica primero en una cuenta demo antes de operar en vivo ✓ No todas las señales son ganadoras - aplica una gestión de riesgo adecuada ✓ Funciona mejor en marcos temporales M15 y superiores
📞 Soporte
Si tienes preguntas sobre la instalación o uso del indicador, contáctanos.
Nota Final: Este indicador es una herramienta de análisis. El éxito en el trading depende de múltiples factores incluyendo gestión de riesgo, psicología y experiencia.
Resumen
This tool works exclusively with currency pairs that include the Japanese Yen (JPY), specifically EURJPY, GBPJPY, USDJPY, AUDJPY, and CADJPY. It does not support metals, stock indices, cryptocurrencies, or pairs without JPY. Users apply the indicator on any of the five JPY pairs to monitor multi-currency strength simultaneously in one window.
Adjustable parameters include the fast and slow periods of the TSI for sensitivity and smoothing. The indicator aids in trend identification, overbought/oversold signal detection, and trade confirmation by comparing relative currency strength. It is recommended for use alongside other analysis methods and on timeframes of 15 minutes or higher.
Valoraciones de clientes
5 | 100 % | |
4 | 0 % | |
3 | 0 % | |
2 | 0 % | |
1 | 0 % |


