Description
Analyse de tendance adaptative utilisant les mathématiques de la régression pondérée par noyau.
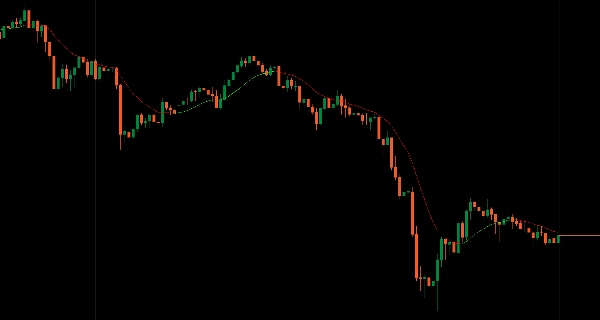
Applique un poids au noyau gaussien où les barres proches influencent davantage et les barres éloignées s'estompent exponentiellement, créant des lignes de tendance ultra-lisses sans décalage à période fixe.
Ajustement automatique à la structure locale des prix, décalage minimal comparé aux moyennes mobiles traditionnelles, codage couleur dynamique (vert citron pour la tendance haussière, rouge pour la tendance baissière), largeur de bande réglable pour ajuster la réactivité, fenêtre de retour flexible (50-2000 barres), et conception bicolore sans bruit offrant une identification de tendance mathématiquement précise pour les traders recherchant un lissage adaptatif sans sélection arbitraire de période.
CARACTÉRISTIQUES
Calcul pondéré par noyau
- Les barres proches influencent davantage, les barres éloignées s'estompent exponentiellement — pas de périodes fixes arbitraires
- Pondération par noyau gaussien pour un lissage mathématiquement optimal
- S'ajuste automatiquement à la structure locale des prix sans recalibrage manuel
- Décalage minimal : répond plus rapidement aux changements de tendance réels que les moyennes mobiles équivalentes
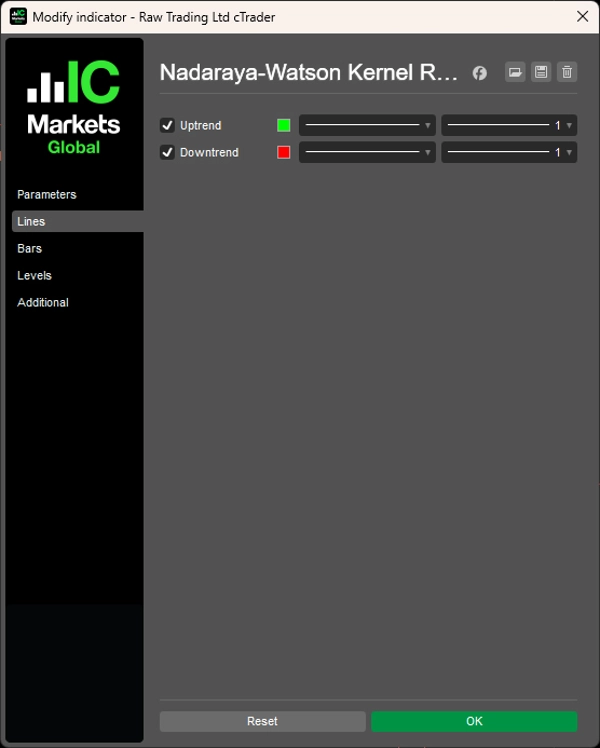
Codage couleur dynamique
- Vert citron : tendance haussière
- Rouge : tendance baissière
- Confirmation visuelle instantanée de la direction de la tendance
- Affichage discontinu de la ligne : les changements de couleur sont instantanés et visuellement clairs
Paramètres réglables
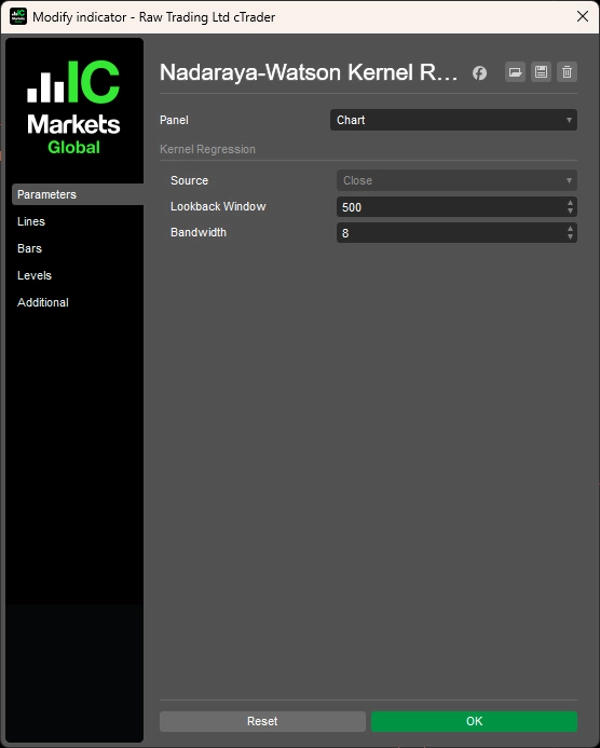
- Largeur de bande : ajustez finement la réactivité par rapport à la douceur
- Fenêtre de retour flexible : 50-2000 barres pour correspondre à votre période
- S'adapte à différentes conditions de marché et styles de trading
Design épuré
- Deux couleurs, zéro encombrement — soit en tendance haussière, soit en tendance baissière
- Identification de tendance sans bruit
- Aucun réglage complexe requis
- Simplicité visuelle avec précision mathématique
__________________________________________________________________________________________
PLUS D'INDICATEURS GRATUITS
Explorez une large gamme d'outils d'analyse de marché — de la structure et du volume à la régression, la volatilité et les périodes personnalisées.
Le code source est disponible sur le dépôt GitHub.
Tous gratuits à utiliser. Mais si vous souhaitez offrir un café en soutien, vous pouvez le faire ici.
Support/Résistance
Volume
- Profileur d'Activité de Volume
- Analyseur d'Efficacité du Volume
- Analyse du Profil de Volume
- Profil de Volume - Mis à jour
- Analyse de la Répartition du Volume
- VWAP (Prix Moyen Pondéré par le Volume)
Moyennes Mobiles
- Canal SSL
- Moyenne Mobile Ancrée
- Moyenne Mobile Échelonnée par Écart
- Activateur Haut Bas de Gann
- Ligne de Tendance Instantanée
- Moyenne Mobile Adaptative de Kaufman avec Vision de Tendance
- Canal de Moyenne Mobile
- Suite de Moyennes Mobiles
- Moyenne Mobile du Canal de Tendance
Utilitaires/Personnalisé
Basé sur la Régression
Volatilité
Oscillateurs
__________________________________________________________________________________________
AVERTISSEMENT
Le trading comporte des risques. Cet indicateur est destiné uniquement à l'analyse technique — appliquez toujours une gestion des risques appropriée et tradez de manière responsable.
RETROACTION & AMÉLIORATIONS
Si vous avez des suggestions, des demandes de fonctionnalités ou des idées d'amélioration, veuillez laisser un commentaire dans l'onglet Discussion. Vos retours aident à améliorer l'indicateur pour tous.
Résumé
Key features include dynamic color coding with lime indicating uptrends and red indicating downtrends, offering instant visual confirmation of trend direction through a noise-free, two-color design. Users can fine-tune the indicator’s responsiveness and smoothness via adjustable bandwidth and select a flexible lookback window ranging from 50 to 2000 bars to suit various timeframes and market conditions.
The indicator emphasizes mathematical precision and visual simplicity, requiring no complex settings. It is designed for traders seeking an adaptive smoothing method for trend identification without arbitrary period selection. This tool supports scalping strategies and is part of a broader suite of market analysis indicators focused on regression, volume, volatility, and custom timeframes.
Avis clients
5 | 100 % | |
4 | 0 % | |
3 | 0 % | |
2 | 0 % | |
1 | 0 % |