
Description
🔥 Pinescritlabs
Indicateurs Ctrader Store: 🤖Pinescritlabs cBots du Ctrader Store :
Fair Value Gap Sessions Gold & BTC Breakout Session Pivots
Dynamic Market Structure
Analyse des points de retournement
Fibonacci Linear
Régression multi-échelle
Multi-Level Candle Bias
Tracker
Auto Support and
Resistance Trend Lines
All Support and
Resistance Levels
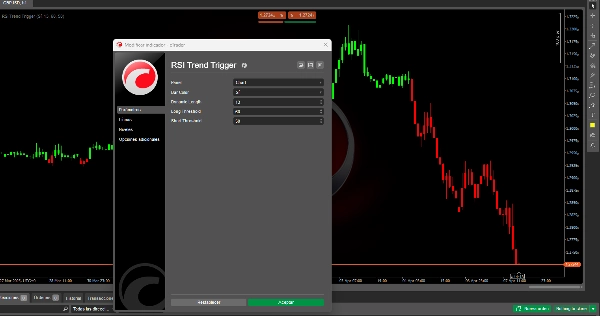
RSI Trend Trigger 📈✨
Comment ça marche ? 🤔
Étape 1 : RSI traditionnel
L'indice standard Relative Strength Index (RSI) est calculé, mesurant la vitesse et l'amplitude des mouvements de prix sur une période donnée. Il oscille entre 0 et 100, identifiant les conditions de surachat (par exemple, au-dessus de 70) et de survente (par exemple, en dessous de 30). 📊📉📈
Étape 2 : Raffinement dynamique
Le RSI traditionnel subit un processus de lissage avancé :
- Un deuxième calcul mathématique est appliqué aux valeurs RSI originales (pas au prix lui-même).
- Cette étape crée une version plus stable du RSI, réduisant les fluctuations mineures (bruit du marché) et mettant en évidence les tendances réelles.
- Contrairement au lissage basique, cette méthode préserve la réactivité aux changements significatifs de momentum, évitant les retards excessifs. 🛡️🔄
Pourquoi ce raffinement est-il important ? 🤩
- Filtrage intelligent : Élimine les faux signaux causés par la volatilité temporaire, comme les pics liés aux actualités ou les mouvements spéculatifs. �🗑️
- Tendances plus nettes : L'approche à double calcul distingue les corrections mineures des véritables retournements de tendance. 🎯
- Signaux persistants : Une fois qu'une tendance (haussière/baissière) est confirmée, l'indicateur la maintient jusqu'à ce qu'un retournement clair se produise, évitant les sauts erratiques de signal. 🔒
Utilisation pratique : seuils et prise de décision 📈
Le RSI affiné se combine avec deux seuils ajustables :
- Seuil haussier (par exemple, 60) :
-
- Si le RSI affiné dépasse ce niveau, une tendance haussière est confirmée. 🚀
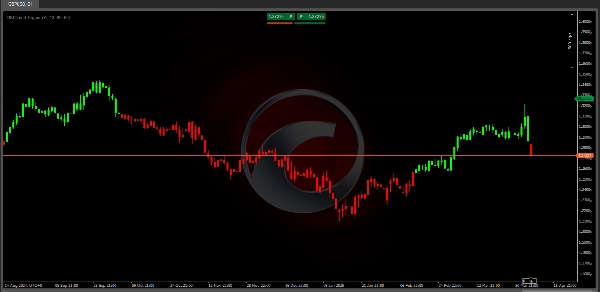
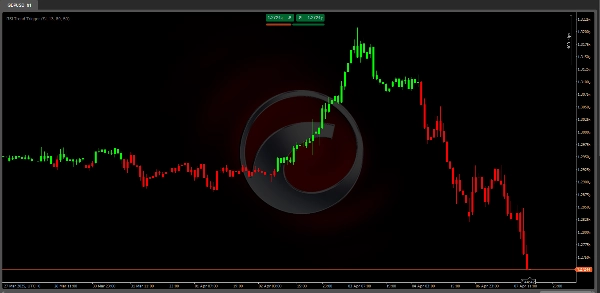
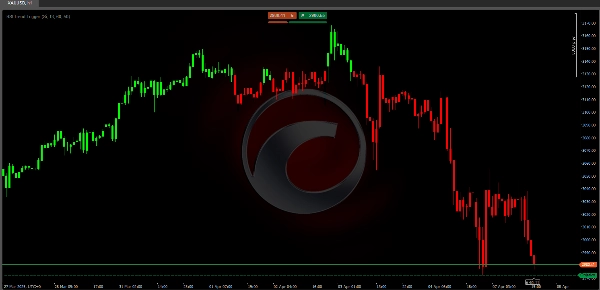
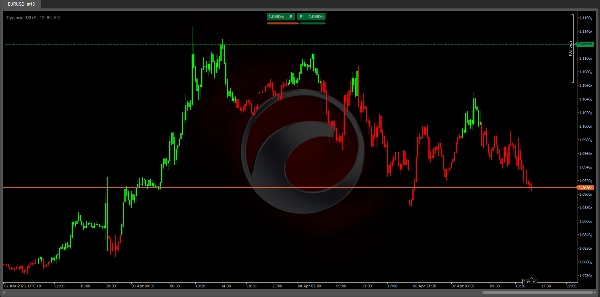
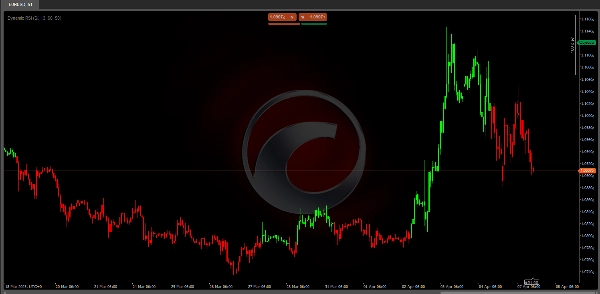
- Les chandeliers deviennent verts
- Seuil baissier (par exemple, 50) :
-
- Si le RSI affiné descend en dessous de ce niveau, une tendance baissière est déclenchée. 📉
- Les chandeliers deviennent rouges
Règle clé :
- Les signaux n'apparaissent que lors des changements de tendance (pas à chaque fluctuation), réduisant la surcharge d'informations. 🚫📢
- Les seuils sont personnalisables : utilisez des valeurs plus élevées (par exemple, 65/55) pour les marchés volatils ou des valeurs plus basses (par exemple, 55/45) pour des tendances plus douces. ⚙️
Avantages pour les traders 🏆
- Précision améliorée :
-
- Moins de faux signaux grâce au filtrage à double couche. Idéal pour les marchés latéraux ou les faux signaux. ✅
- Visualisation intuitive :
-
- Les chandeliers colorés et les seuils visuels permettent de repérer instantanément les tendances. 👀🎨
- Adaptabilité :
-
- Fonctionne sur différents actifs (forex, actions, crypto) et différentes échelles de temps (minutes à semaines). 🌍⏳
- Trading axé sur la tendance :
-
- Aide à trader avec le momentum, évitant les mouvements contre-tendance risqués. 🎯🚦
Exemple de flux de signaux
Imaginez que le RSI affiné est à 55 (zone neutre) :
- Scénario haussier : Monte à 62 → Traverse le seuil de 60 → Les chandeliers deviennent verts🚀
- Scénario baissier : Descend à 48 → Franchit le seuil de 50 → Les chandeliers deviennent rouges📉
Résumé
The indicator then applies an advanced smoothing process to the RSI values, not the price data, creating a refined RSI that reduces minor market noise while maintaining sensitivity to significant momentum changes. This dual-layer calculation enhances signal precision by filtering out false signals caused by temporary volatility and distinguishing between minor corrections and genuine trend reversals.
Users can customize two threshold levels—a bullish threshold (e.g., 60) and a bearish threshold (e.g., 50)—to define when a trend is confirmed. When the refined RSI crosses above the bullish threshold, the indicator signals a bullish trend with green candles; when it falls below the bearish threshold, it signals a bearish trend with red candles. Signals appear only during trend changes, reducing information overload.
The RSI Trend Trigger supports multiple timeframes from minutes to weeks and is adaptable to different market conditions, aiding traders in aligning with momentum and avoiding counter-trend risks.
Avis clients
5 | 67 % | |
4 | 33 % | |
3 | 0 % | |
2 | 0 % | |
1 | 0 % |


