
Description
APERÇU
L'indicateur Waddah Attar Explosion (WAE) a été créé par Ahmad Waddah Attar et présenté à la communauté des traders en 2007. Il combine la mesure de l'élan MACD avec l'analyse de la volatilité des bandes de Bollinger pour identifier les moments d’« explosion des prix » — des périodes où le prix passe de la consolidation à un mouvement directionnel fort.
L'indicateur répond à deux questions :
- L'élan est-il en train de se renforcer ? (mesuré par le taux de variation du MACD)
- La volatilité est-elle en expansion ? (mesurée par la largeur des bandes de Bollinger)
Lorsque les deux conditions sont réunies au-dessus d'un filtre de bruit (Zone Morte), cela signale un mouvement explosif potentiel.
COMPOSANTS
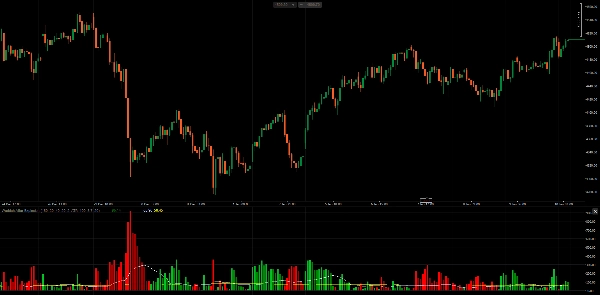
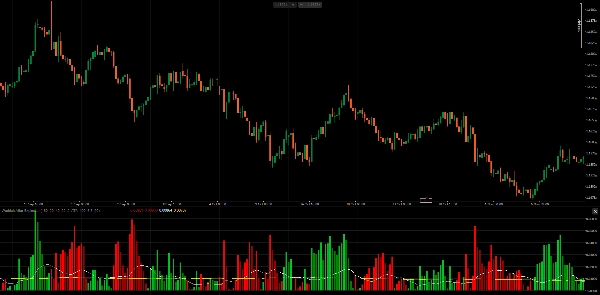
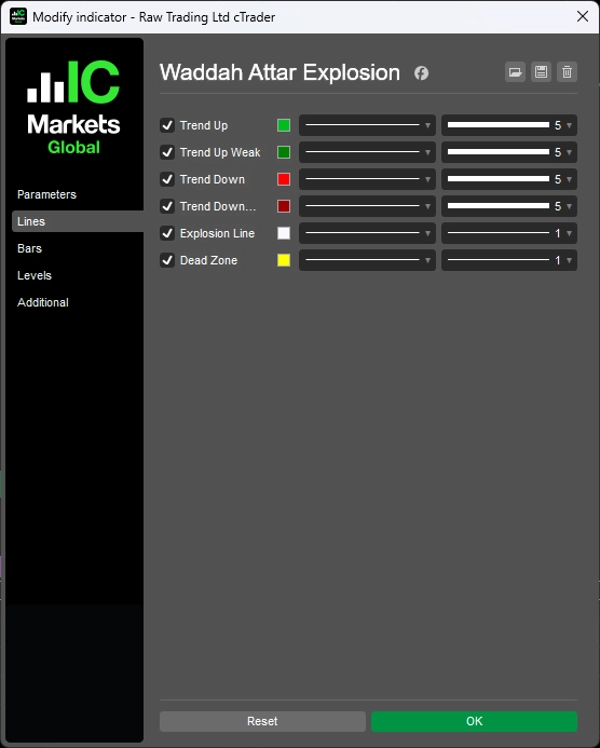
1. Histogramme de tendance (Vert/Rouge) Affiche le taux de variation de la ligne MACD, multiplié par un facteur de sensibilité.
- Calcul :
(MACD_current - MACD_previous) × Sensitivity - Barres vertes : Élan haussier (MACD accélérant vers le haut)
- Barres rouges : Élan baissier (MACD accélérant vers le bas)
- Couleur claire : Élan en augmentation par rapport à la barre précédente
- Couleur foncée : Élan en diminution par rapport à la barre précédente
2. Ligne d'explosion (Blanche) Représente la largeur des bandes de Bollinger, indiquant l'expansion ou la contraction de la volatilité.
- Calcul :
BB_Upper - BB_Lower - En hausse : Volatilité en expansion (rupture potentielle)
- En baisse : Volatilité en contraction (consolidation)
3. Zone Morte (Jaune) Un filtre seuil pour éliminer les signaux faibles causés par le bruit du marché.
- Basé sur l'ATR : S'adapte à la volatilité actuelle du marché
- Pips fixes : Valeur seuil statique
COMMENT AHMAD WADDAH ATTAR L'UTILISE
Selon l'auteur original :
Règles d'entrée pour l'achat Toutes les conditions doivent être remplies :
- L'histogramme vert est en hausse
- L'histogramme vert est au-dessus de la Ligne d'explosion
- La Ligne d'explosion est en hausse
- L'histogramme vert et la Ligne d'explosion sont tous deux au-dessus de la Zone Morte
Règles d'entrée pour la vente Toutes les conditions doivent être remplies :
- L'histogramme rouge est en hausse
- L'histogramme rouge est au-dessus de la Ligne d'explosion
- La Ligne d'explosion est en hausse
- L'histogramme rouge et la Ligne d'explosion sont tous deux au-dessus de la Zone Morte
Règles de sortie
- Sortir long lorsque l'histogramme vert passe en dessous de la Ligne d'explosion
- Sortir court lorsque l'histogramme rouge passe en dessous de la Ligne d'explosion
Insight clé L'angle de la Ligne d'explosion est important. Lorsque la Ligne d'explosion est inclinée vers le haut et que l'histogramme la dépasse, cela confirme que la volatilité augmente activement — l’« explosion » est réelle, pas un faux signal.
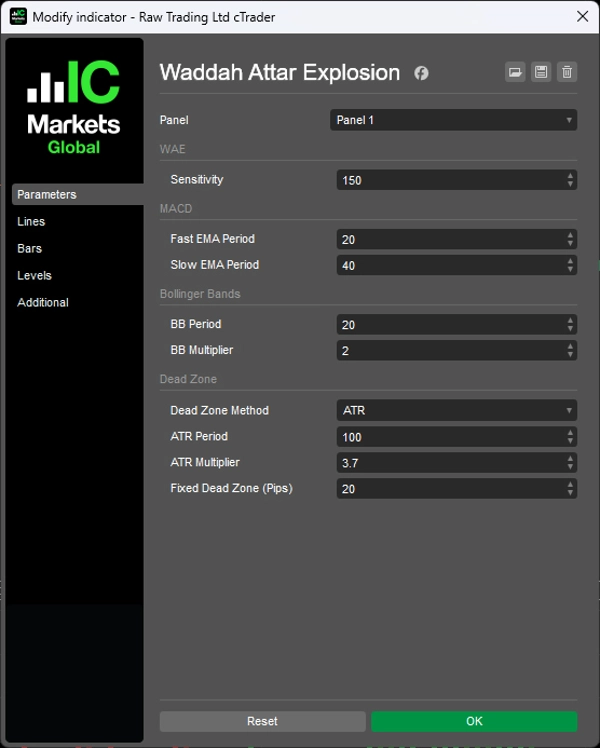
PARAMÈTRES
1. Sensibilité
- Sensibilité (150) : Multiplicateur pour le taux de variation du MACD
2. MACD
- Période EMA rapide (20) : Moyenne mobile rapide pour le calcul du MACD
- Période EMA lente (40) : Moyenne mobile lente pour le calcul du MACD
3. Bandes de Bollinger
- Période BB (20) : Période de retour des bandes de Bollinger
- Multiplicateur BB (2.0) : Multiplicateur de l'écart-type
4. Zone Morte
- Méthode Zone Morte (ATR) : Choix entre basé sur l'ATR ou Pips fixes
- Période ATR (100) : Période pour le calcul de l'ATR
- Multiplicateur ATR (3.7) : Multiplicateur appliqué à l'ATR pour la Zone Morte
- Zone Morte Fixe (20) : Valeur de la Zone Morte en pips (lors de l'utilisation de la méthode fixe)
REMARQUES
- L'indicateur fonctionne sur toutes les unités de temps. L'auteur original recommandait H1 et M30.
- La Zone Morte basée sur l'ATR est recommandée car elle s'adapte aux différents instruments et conditions de marché.
- Le paramètre Sensibilité peut nécessiter un ajustement en fonction de l'unité de temps et de la volatilité de l'instrument.
- Cet indicateur identifie l'alignement de l'élan et de la volatilité — il ne prédit pas la direction à lui seul. Envisagez de l'utiliser conjointement avec l'analyse de tendance ou les niveaux de support/résistance.
__________________________________________________________________________________________
PLUS D'INDICATEURS GRATUITS
Explorez une large gamme d'outils d'analyse de marché — de la structure et du volume à la régression, la volatilité et les unités de temps personnalisées.
Le code source est disponible sur le dépôt GitHub.
Tous gratuits à utiliser. Mais si vous souhaitez offrir un café en soutien, vous pouvez le faire ici.
Support/Résistance
Volume
- Profileur d'Activité de Volume
- Analyseur d'Efficacité du Volume
- Analyse de Profil de Volume
- Profil de Volume - Mis à jour
- Analyse de Répartition du Volume
- VWAP (Prix Moyen Pondéré par le Volume)
Moyennes Mobiles
- Canal SSL
- Moyenne Mobile Ancrée
- Moyenne Mobile Échelonnée par Déviation
- Activateur Haut Bas de Gann
- Ligne de Tendance Instantanée
- MA Adaptative de Kaufman avec Vision de Tendance
- Canal de Moyenne Mobile
- Suite de Moyennes Mobiles
- Moyenne Mobile du Canal de Tendance
Utilitaires/Personnalisés
Basé sur la Régression
Volatilité
Oscillateurs
__________________________________________________________________________________________
AVERTISSEMENT
Le trading comporte des risques. Cet indicateur est destiné uniquement à l'analyse technique — appliquez toujours une gestion des risques appropriée et tradez de manière responsable.
RETROACTION & AMÉLIORATIONS
Si vous avez des suggestions, des demandes de fonctionnalités ou des idées d'amélioration, veuillez laisser un commentaire dans l'onglet Discussion. Vos retours aident à améliorer l'indicateur pour tous.


