
VWAP Volume Weighted Average Price
อินดิเคเตอร์
เวอร์ชัน 1.0, Oct 2025
Windows, Mac
4.6
รีวิว: 3
คำอธิบาย
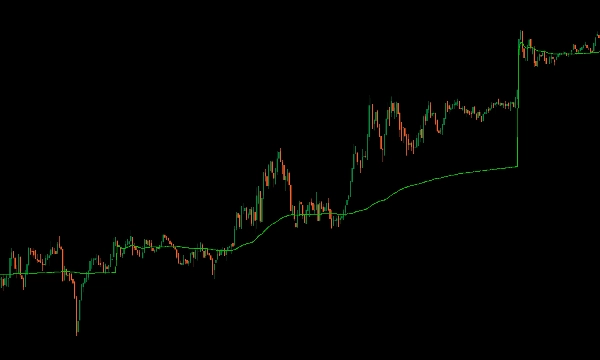
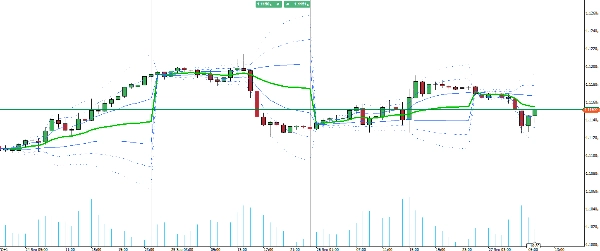
แนะนำ VWAP ตัวบ่งชี้สำหรับ cTrader ที่นำฟังก์ชันการทำงานเต็มรูปแบบของ Volume Weighted Average Price ของ TradingView มาสู่แพลตฟอร์มการซื้อขายของคุณ
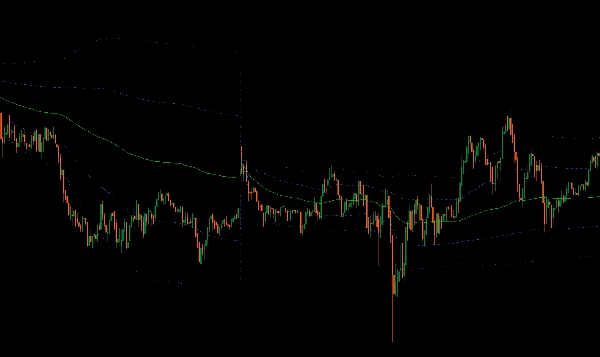
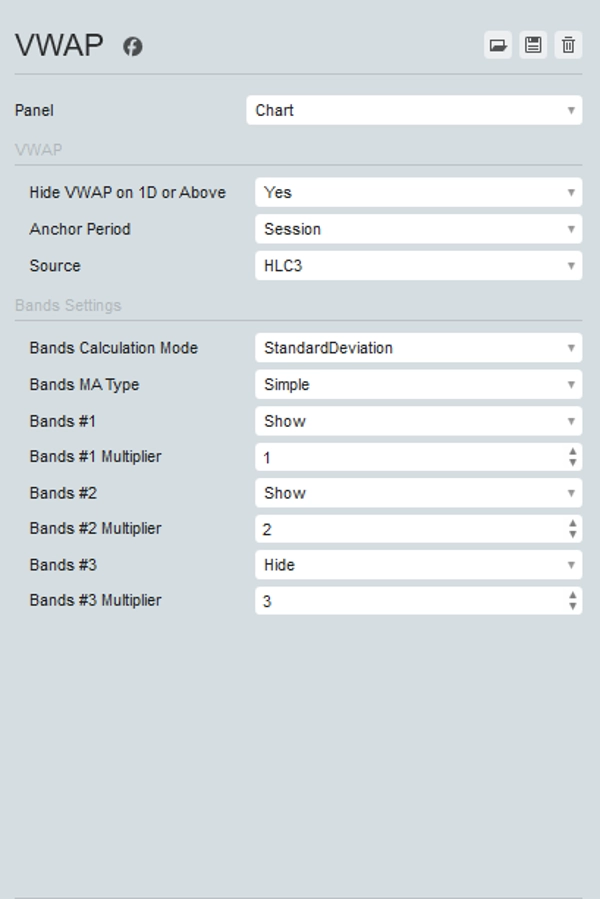
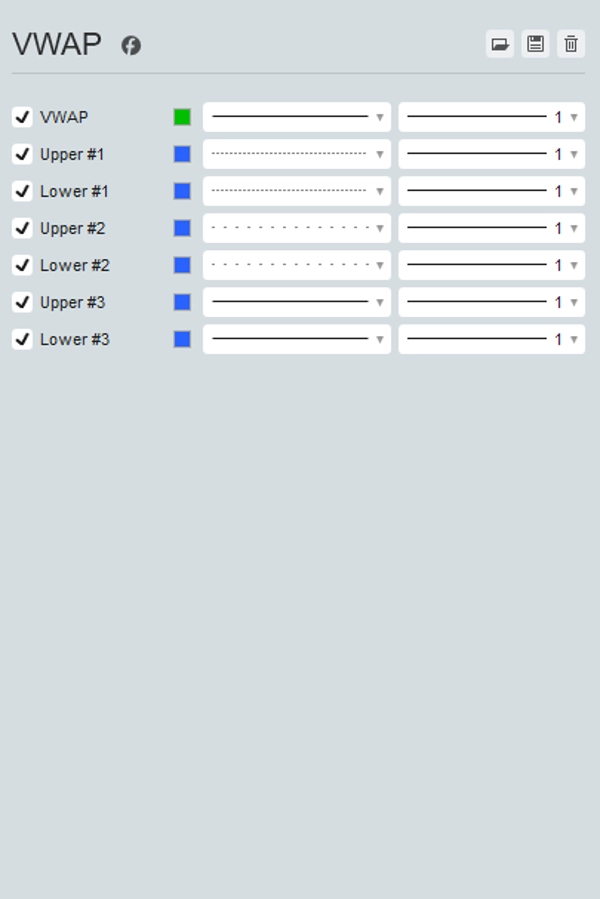
เครื่องมือที่ครอบคลุมนี้ช่วยให้คุณเลือกช่วงเวลาหลัก (Session, Week, Month, Quarter, Year) และเลือกจากแหล่งราคาต่างๆ รวมถึง Open, High, Low, Close, HL2, HLC3, OHLC4 และ HLCC4 นอกจากนี้ยังสามารถแสดงแถบส่วนเบี่ยงเบนมาตรฐานบนและล่างได้สูงสุดสามแถบ เพื่อให้มุมมองที่ครบถ้วนของการกระจายราคา
ตัวบ่งชี้ VWAP อัปเดตแบบเรียลไทม์ด้วยข้อมูล tick เพื่อให้แน่ใจว่าคุณมีข้อมูลเชิงลึกที่ถูกต้องและทันเวลาที่สุดสำหรับการตัดสินใจซื้อขายของคุณ ยกระดับกลยุทธ์การซื้อขายของคุณด้วยตัวบ่งชี้ VWAP ที่หลากหลายและทรงพลังใน cTrader
สรุป
สรุปโดย AI
The VWAP (Volume Weighted Average Price) indicator for cTrader replicates the full functionality of TradingView's VWAP tool. It allows traders to select anchor periods including Session, Week, Month, Quarter, and Year, and choose from multiple price sources such as Open, High, Low, Close, HL2, HLC3, OHLC4, and HLCC4. The indicator also supports displaying up to three standard deviation bands above and below the VWAP line, providing insights into price distribution and volatility. It updates in real time with tick data, ensuring timely and accurate information for trading decisions. This indicator is applicable across various markets including Forex, Crypto, Stocks, Commodities, and Indices, and supports symbols like BTCUSD, EURUSD, GBPUSD, XAUUSD, NAS100, and USDJPY. It is suitable for strategies involving breakout and scalping techniques.
โปรไฟล์อินดิเคเตอร์
รีวิวจากลูกค้า
4.6
รีวิว: 3
5 | 67 % | |
4 | 33 % | |
3 | 0 % | |
2 | 0 % | |
1 | 0 % |
รีวิวจากลูกค้า
October 27, 2025
Solid enough as a backup opinion. Win rate means less without average R.
October 22, 2025
it earns a spot because the trade idea gets a pause before execution. A clean signal can still fail.
October 19, 2025
The idea is fine, just do not expect it to print perfect entries, and The result needs a journal.
การสนทนา
คำถามที่พบบ่อย
BTCUSD
Forex
Breakout
Indices
EURUSD
Commodities
GBPUSD
NZDUSD
Prop
Scalping
Crypto
Stocks
XAUUSD
NAS100
USDJPY
VWAP
ผลิตภัณฑ์ที่มีให้บริการผ่าน cTrader Store รวมถึงบอทการเทรด อินดิเคเตอร์ และปลั๊กอิน มีให้บริการโดยนักพัฒนาบุคคลที่สามและมีไว้เพื่อวัตถุประสงค์ในการเข้าถึงข้อมูลและทางเทคนิคเท่านั้น cTrader Store ไม่ใช่โบรกเกอร์และไม่ได้ให้คำแนะนำการลงทุน คำแนะนำส่วนบุคคล หรือการรับประกันผลการดำเนินงานในอนาคต


!["[Hamster-Coder] Moving Average MTF" โลโก้](https://cdn.ctrader.com/image/webp/b11b98b1-194d-4b8e-b00e-d611826ad159_31226)
ราคา
ตั้งแต่ 25/09/2025
25
การขาย
331
ติดตั้งฟรี