

Penerangan
Penunjuk Garis Trend Auto untuk cTrader – Buka Trend Pasaran Dengan Segera!
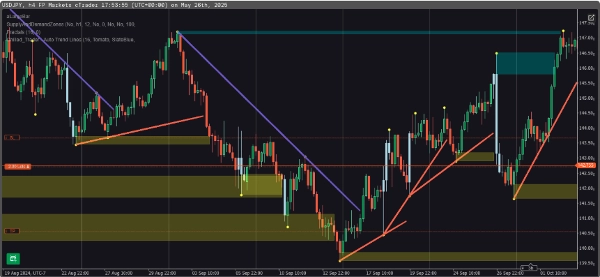
Bawa dagangan anda ke tahap seterusnya dengan Penunjuk Garis Trend Auto—alat yang kuat direka untuk mengesan dan melukis garis trend secara automatik pada carta cTrader anda. Tidak perlu lagi melukis garis trend secara manual—biarkan algoritma pintar mengenal pasti trend pasaran utama dengan ketepatan.
Ciri-ciri:
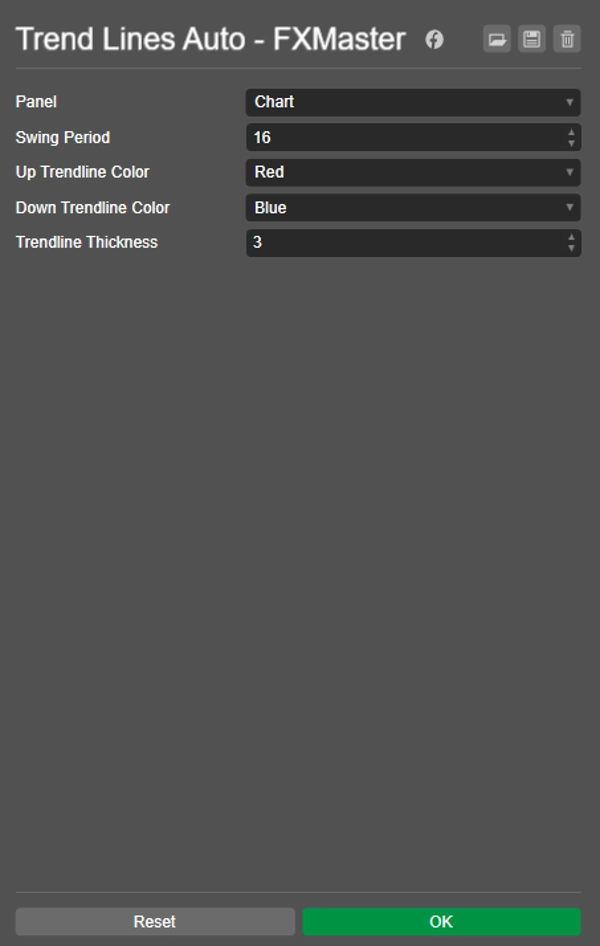
✅ Pengesanan Trend Automatik – Tiada lagi tekaan! Penunjuk mengimbas tindakan harga dan segera melukis garis trend. ✅ Ambang Boleh Disesuaikan – Tetapkan kepekaan untuk mengesan trend pasaran yang signifikan. ✅ Visual Jelas – Pilih ketebalan & warna garis pilihan anda untuk keterbacaan carta yang lancar. ✅ Kemas Kini Masa Nyata – Kekal di hadapan perubahan pasaran dengan garis trend yang menyesuaikan secara dinamik. ✅ Berfungsi di Mana-mana Pasaran – Gunakan untuk Forex, Saham, Komoditi, atau Kripto—boleh disesuaikan untuk semua jangka masa.
Mengapa Pilih Penunjuk Ini?
- Berdagang Dengan Keyakinan – Kenal pasti pembalikan trend utama sebelum ia berlaku.
- Jimat Masa – Tiada keperluan untuk menganalisis struktur trend secara manual.
- Tingkatkan Ketepatan – Membantu pedagang memperbaiki kemasukan & keluar berdasarkan pengesahan trend yang kukuh.
💡 Serasi dengan Platform cTrader – Integrasi mudah untuk pedagang profesional.
🔹 Kawal dagangan anda hari ini! Dapatkan Penunjuk Garis Trend Auto untuk cTrader dan kuasai analisis trend dengan mudah. 🚀
Ringkasan
Key features include:
- Automatic trend detection with customizable sensitivity thresholds.
- Clear visual customization options for line thickness and colors.
- Dynamic updates that adjust trend lines as market conditions change.
- Compatibility with the cTrader platform for seamless integration.
This indicator aims to help traders identify major trend reversals early, save time by automating trend analysis, and improve trading accuracy by confirming strong trends for better entry and exit decisions.
Ulasan pelanggan
5 | 33 % | |
4 | 67 % | |
3 | 0 % | |
2 | 0 % | |
1 | 0 % |


![Logo "Gaussian Channel [Iridio Capital]"](https://cdn.ctrader.com/image/webp/7c039209-5573-4a54-a072-f9528b503103_41960)


