
설명
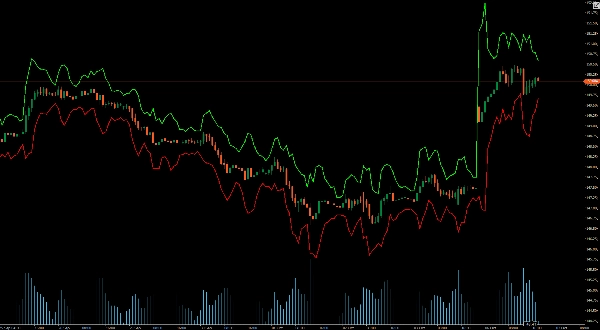
ATR 밴드는 가격 차트에 상단 및 하단 밴드를 동적으로 표시합니다.
이 밴드는 시장 변동성에 대한 실시간 통찰력을 제공하여 잠재적인 돌파 및 반전 지점을 정확하게 식별하는 데 도움을 줍니다. 모든 수준의 트레이더에게 적합한 ATR 밴드는 손절매, 이익 실현 설정 및 진입점 최적화를 위한 명확한 시각적 신호를 제공하여 의사 결정 과정을 향상시킵니다.
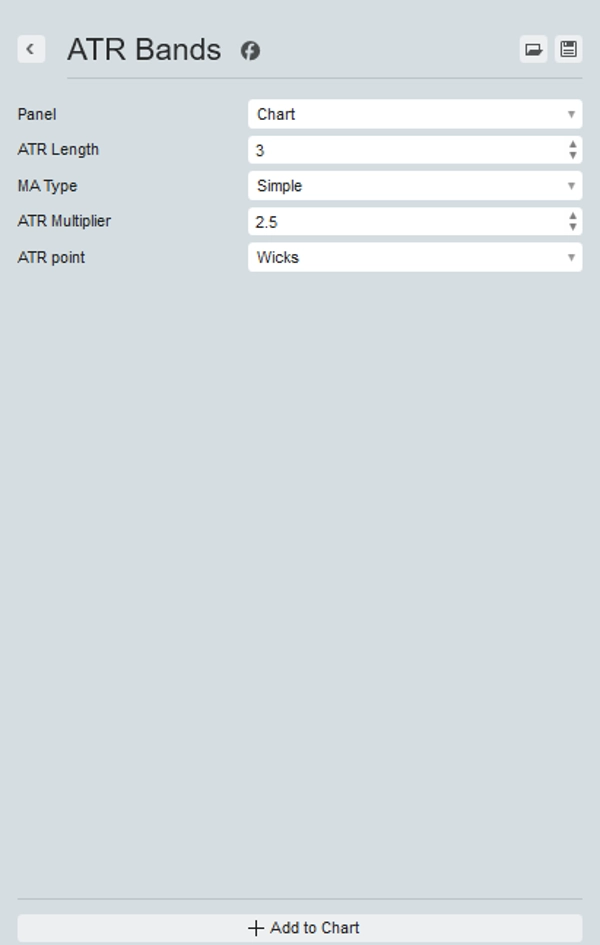
설정에서는 선호하는 기간과 배수를 선택하고, ATR 계산에 사용되는 이동 평균을 변경하며, 캔들 심지 또는 캔들 종가를 사용할 수 있습니다.
오늘 거래 도구 키트를 업그레이드하고 ATR 밴드와 함께 시장에서의 차이를 경험해 보세요 – 당신의 시장 우위입니다.
요약
AI 요약
ATR Bands is a trading indicator that dynamically plots upper and lower bands on price charts based on the Average True Range (ATR). These bands provide real-time visualization of market volatility, assisting traders in identifying potential breakout and reversal points. The indicator supports customizable settings, including the choice of period and multiplier, selection of the moving average type used to calculate ATR, and the option to base calculations on candle wicks or candle closes. ATR Bands are applicable across various markets such as Forex, cryptocurrencies (e.g., BTCUSD), commodities, indices, and stocks. By offering clear visual cues, this tool aids in optimizing entry points, as well as setting stop-loss and take-profit levels.
지표 프로필
고객 리뷰
4.6
리뷰: 3
5 | 67 % | |
4 | 33 % | |
3 | 0 % | |
2 | 0 % | |
1 | 0 % |
고객 리뷰
October 19, 2025
weak entries have a harder time slipping through, but risk control still needs say no.
October 14, 2025
The better read comes from there is a useful pause before the click, and a few signals across sessions tell more.
October 13, 2025
상담
자주 묻는 질문(FAQ)
BTCUSD
Forex
Breakout
Indices
EURUSD
Commodities
GBPUSD
NZDUSD
Prop
Crypto
Stocks
XAUUSD
NAS100
ATR
USDJPY
트레이딩 봇, 지표, 플러그인 등 cTrader Store에서 제공되는 상품은 제3자 개발자에 의해 제공되며, 이는 단순히 정보 및 기술적 접근을 목적으로 제공된 것입니다. cTrader Store는 중개인이 아니며, 투자 조언, 개인별 추천 또는 향후 성과에 대한 어떠한 보장도 제공하지 않습니다.


좋아하실 만한 다른 항목


가격
가입일 25/09/2025
25
판매
315
무료 설치