
Penerangan
Memperkenalkan Penunjuk Indeks Kekuatan Sebenar (TSI), alat yang kuat direka untuk meningkatkan strategi perdagangan anda dengan memberikan pandangan yang jelas mengenai momentum pasaran dan kekuatan tren.
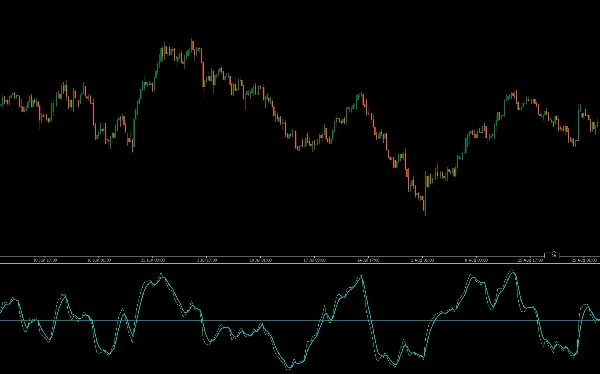
Penunjuk TSI mengukur kekuatan asas pergerakan harga, meratakan bunyi pasaran untuk memberi anda gambaran yang lebih tepat mengenai arah tren. Dengan menonjolkan keadaan terlebih beli dan terlebih jual, TSI membantu anda mengenal pasti titik pembalikan yang berpotensi dan mengesahkan kesinambungan tren.
TSI menggunakan purata bergerak daripada momentum asas instrumen kewangan. Momentum dianggap sebagai penunjuk utama pergerakan harga, dan purata bergerak biasanya tertinggal di belakang harga. TSI menggabungkan ciri-ciri ini untuk mencipta petunjuk harga dan arah yang lebih selari dengan perubahan pasaran berbanding sama ada momentum atau purata bergerak.
Sesuai untuk pedagang yang ingin memperhalusi analisis mereka dan meningkatkan pembuatan keputusan, penunjuk TSI menawarkan cara yang boleh dipercayai dan intuitif untuk mengukur dinamik pasaran. Tingkatkan alat perdagangan anda dengan Indeks Kekuatan Sebenar untuk prestasi perdagangan yang unggul.
- Pengenalpastian tren: TSI positif menunjukkan tren menaik, manakala TSI negatif mencadangkan tren menurun.
- Kekuatan momentum: Ia mengukur sejauh mana tren bergerak dengan kuat, dengan nilai yang lebih tinggi menunjukkan momentum yang lebih kuat.
- Isyarat pembalikan berpotensi:
-
- Persilangan: Persilangan garis isyarat berhampiran garis sifar boleh menandakan titik kemasukan dan keluar yang berpotensi.
- Divergensi: Apabila harga mencapai paras tinggi atau rendah baru, tetapi TSI gagal berbuat demikian, ia boleh menandakan pembalikan tren yang berpotensi.
- Keadaan terlebih beli/terlebih jual: Ia boleh membantu mengenal pasti bila aset mungkin terlebih beli atau terlebih jual, walaupun paras terlebih beli dan terlebih jual yang spesifik boleh berbeza bergantung pada volatiliti aset.
Ringkasan
Ulasan pelanggan
5 | 0 % | |
4 | 100 % | |
3 | 0 % | |
2 | 0 % | |
1 | 0 % |


