Penerangan
Memperkenalkan penunjuk Purata Pergerakan yang dipertingkatkan, direka untuk penyesuaian dan fleksibiliti yang lebih baik dalam analisis perdagangan anda.
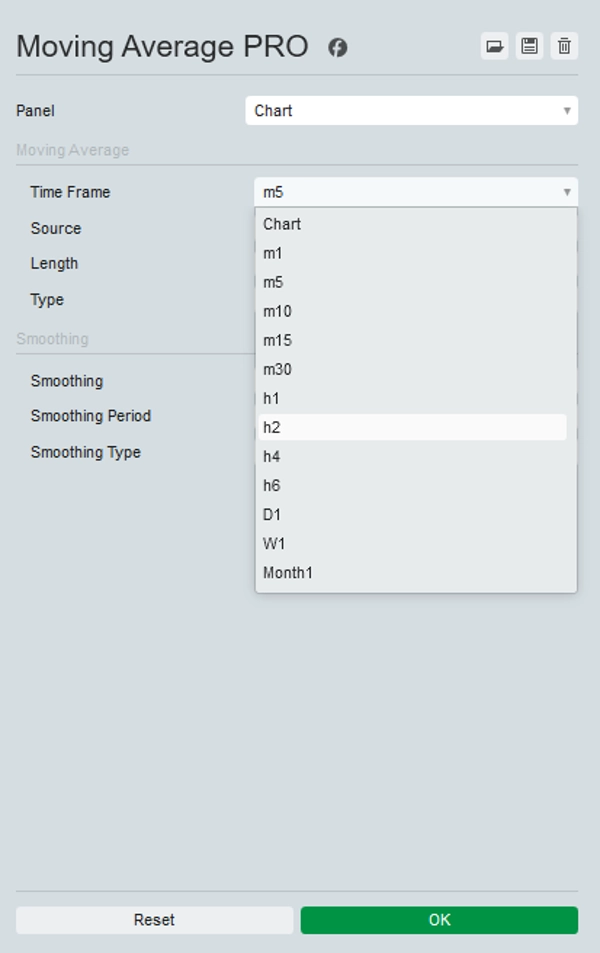
Versi yang dipertingkatkan ini juga menyokong purata pergerakan bingkai masa yang lebih tinggi kepada bingkai masa tick dan Heikin Ashi. Tempoh Renko dan Julat masih belum disokong.
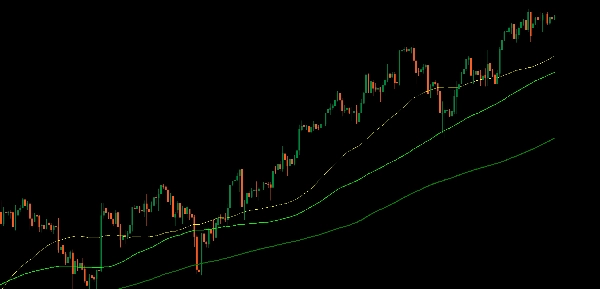
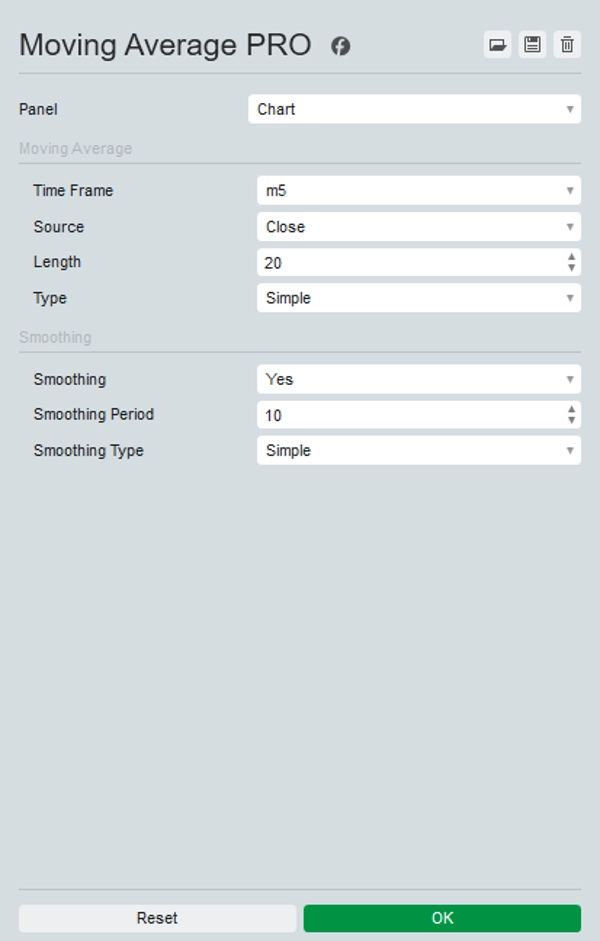
Penunjuk ini membolehkan anda memilih mana-mana bingkai masa yang membolehkan anda memaparkan, sebagai contoh, MA 200 harian pada mana-mana bingkai masa lain.
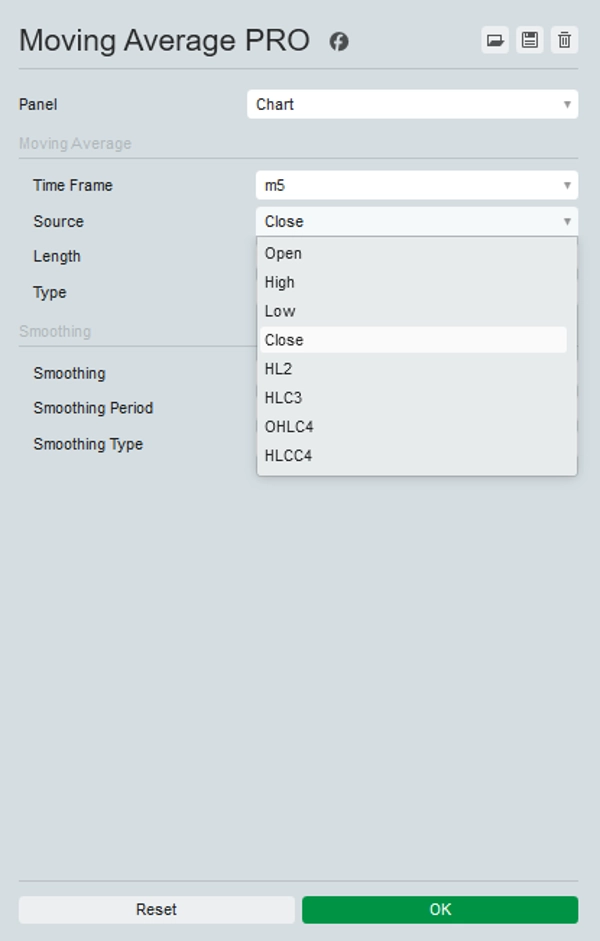
Selain itu, ia menawarkan pelbagai sumber harga untuk dipilih, termasuk Buka, Tinggi, Rendah, Tutup, HL2, HLC3, OHLC4, dan HLCC4, sama seperti dalam TradingView dan pilihan pelicinan pilihan untuk menangani isu pensampelan pada bingkai masa yang lebih rendah.
Dengan menyediakan pilihan ini, anda boleh menyesuaikan Purata Pergerakan agar sesuai dengan strategi perdagangan khusus anda dan memperoleh pandangan yang lebih tepat mengenai trend pasaran.
Tingkatkan alat perdagangan anda dengan penunjuk Purata Pergerakan yang dipertingkatkan untuk analisis dan pembuatan keputusan yang lebih baik.
Ringkasan
Ulasan pelanggan
5 | 100 % | |
4 | 0 % | |
3 | 0 % | |
2 | 0 % | |
1 | 0 % |