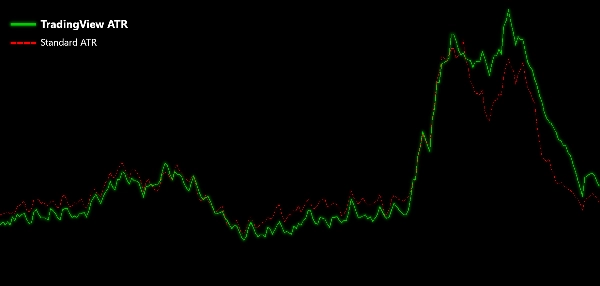
โบรกเกอร์และ Props
สำหรับธุรกิจ
00
Days
:
00
Hours
:
00
Minutes
:
00
Seconds
อินดิเคเตอร์
NAS100
NZDUSD
XAUUSD
Commodities
Forex
EURUSD
GBPUSD
BTCUSD
Indices
Prop
ATR
Stocks
Crypto
USDJPY
TradingView ATR
07/11/2025
Desktop
ตั้งแต่ 25/09/2025
การขาย
11
"TradingView ATR" ภาพที่อัปโหลด"TradingView ATR" ภาพที่อัปโหลด

Introducing the TradingView ATR indicator for cTrader, designed to match the precision of TradingView’s Average True Range calculation.

This enhanced ATR uses a Relative Moving Average (RMA) for its calculations, providing a more accurate reflection of market volatility compared to the default ATR in cTrader. By incorporating the RMA, this indicator offers smoother and more responsive volatility readings, helping you make better-informed trading decisions.

Perfect for traders seeking improved accuracy in their technical analysis, this ATR indicator is a powerful tool to elevate your trading strategy.

Upgrade your cTrader toolkit with this ATR indicator for precise and reliable volatility insights.

0.0
รีวิว: 0
รีวิวจากลูกค้า
ยังไม่มีรีวิวสำหรับผลิตภัณฑ์นี้ หากเคยลองแล้ว ขอเชิญมาเป็นคนแรกที่บอกคนอื่น!
เพิ่มเติมจากผู้เขียนคนนี้
ยอดนิยม
$ 18
/
$20
Chandelier Exit
Optimize exits with Chandelier Exit! Visualize stop-loss points dynamically for improved trading precision and safety.
ยอดนิยม
$ 15
ATR Bands
Enhance trading with ATR Bands! Visualize market volatility using dynamic upper and lower ATR bands for precise decision
MACD Crossover PRO
Customize the MACD! Choose colors, get real-time tick updates, and see crossover points for enhanced trading precision.
ยอดนิยม
$ 15
MACD Histogram PRO
Enhance MACD Histogram! Visualize bull and bear price changes with vibrant colors for clearer, more insightful trading.
QQE Qualitative Quantity Estimation
Unlock trading precision with QQE! Dual QQE indicators with a Bollinger Bands zero line provide clear buy/sell signals.
Stochastic RSI PRO
Unlock Stochastic RSI PRO in cTrader! Overlay RSI, highlight zones, and identify divergences with customizable settings.
ยอดนิยม
$ 15
Consolidation Zones
Identify and trade breakouts with Consolidation Zones! Visualize price consolidation areas for trading opportunities.
Moving Average PRO
Customize your Moving Average! Choose any timeframe and price source for precision and flexibility in your analysis.
VWAP Volume Weighted Average Price
Unlock VWAP in cTrader! Choose anchor periods, price sources, and display deviation bands with real-time tick updates.
Standard Deviation Channel
Visualize trends with Standard Deviation Channel! Display median, and add customizable upper/lower deviation channels.
TSI True Strength Index
Enhance trading with TSI! Use the True Strength Index for clear insights into market momentum and trend strength.
Bollinger Bands Cloud
Visualize Bollinger Bands with a colored cloud for clarity. Enhance your trading precision with this dynamic indicator!
นอกจากนี้คุณยังอาจชอบ
IR Macd on Chart
this indicator show macd on chart.
Cumulative Delta Candles + VolumeProfile
Cumulative delta candles + volume profile
อินดิเคเตอร์
NAS100
NZDUSD
Martingale
+26
Volume Bubble
Volume Bubbles is a lightweight yet powerful visual indicator for cTrader
Prediction Based on Linreg & ATR
📊Predicts price movement by combining multi-timeframe trend analysis, market volatility 📉, and..
Market Sessions Pre
The Market Sessions indicator is a popular tool for visually representing global trading sessions on a price chart.
AlgoCorner Oscillator Scanner
Scan multiple oscillators, timeframes, and symbols from one indicator, with alerts included.
อินดิเคเตอร์
Indices
Prop
Commodities
+4
Half Trend BT
Half Trend BT by BullittTraders
เรตติ้งสูง
ฟรี
VWAP Pro
Advanced VWAP with up to 30 anchored levels, multiple timeframes, memory mode, standard deviation bands & simple GUI
Future_AI_Indicator
Future-AI indicator.
Linear Regression Oscillator
The Linear Regression Oscillator (LRO) is a technical indicator based on linear regression analysis.
AlgoCorner DonchianPSAR
Visualize market asymmetry like never before — steady climbs meet sudden drops with the Donchian PSAR
ยอดนิยม
$ 15
ORB v1
Opening Range Breakout (ORB) - Visual Edition
เรตติ้งสูง
ฟรี
Free Volume Profile v2.0
Supply and Demand
Auto Supply and Demand Automatically identifies the zones of highest trading activity on your chart. 📊
Footprint Chart_noSourceCode
"Footprint Chart: Visualize bid-ask volume inside candles for clearer order flow and market depth insights."
Multi Time Frame Candles FVG Liqudity smc
Multi-Time Frame Candlesticks FVG with BSL/SSL Premium Suite
ยอดนิยม
$ 15
อินดิเคเตอร์
Indices
Stocks
Commodities
+2
Series - FXMaster
Consecutive Series Moves — Reveal the True Pulse of Price Action
indicator
Multi-timeframe candlesticks!