Descrizione
🎯 FlowFX Visual Risk Execution Terminal
L'interfaccia visiva definitiva per la gestione professionale del rischio in cTrader.
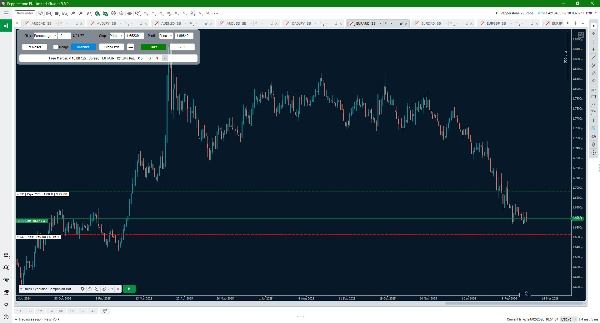
Smetti di calcolare manualmente le dimensioni delle posizioni. Il FlowFX Visual Risk Execution Terminal trasforma il tuo grafico in una dashboard di esecuzione interattiva, permettendoti di definire i tuoi trade visivamente usando linee drag-and-drop mentre l'indicatore gestisce i calcoli complessi in tempo reale.
🚀 Caratteristiche principali
- Pianificazione visiva del trade: Mappa direttamente sul grafico di candele il tuo Entry, Stop Loss e Take Profit.
- Dimensionamento dinamico del lotto: Calcola automaticamente il volume esatto basato sul saldo del tuo conto, equity o un importo fisso in denaro.
- Proiezione PnL: Vedi esattamente quanto puoi guadagnare o perdere nella valuta del tuo conto prima di impegnarti nel trade.
- Modalità Batch Sync: Proietta una "Linea Obiettivo" sul grafico per vedere come spostare le uscite influenzerà il PnL cumulativo di tutte le posizioni aperte.
- HUD High-Tech: Un'interfaccia minimalista e ad alte prestazioni progettata da un ingegnere senior di sistemi per non interferire con la tua analisi dell'azione del prezzo.
🤖 L'ecosistema di esecuzione
Per convertire questi piani visivi in ordini live con latenza zero, questo indicatore si abbina perfettamente al Quick Execution Companion Bot. L'indicatore calcola "l'intento" e il bot companion gestisce "l'esecuzione".
🔗 Completa la tua suite:
Scarica il GRATIS Quick Execution Companion Bot per esecuzioni con un clic.
💬 Supporto e feedback
Progettato per la precisione. Se hai richieste di funzionalità o trovi un bug, miglioriamo insieme il terminale, non esitare a contattarci! 🛠️
Smetti di indovinare il tuo rischio. Visualizzalo con FlowFX. ⚡
Riepilogo
Recensioni dei clienti
5 | 100 % | |
4 | 0 % | |
3 | 0 % | |
2 | 0 % | |
1 | 0 % |


