
Penerangan
Memperkenalkan Penunjuk Saluran Sisihan Piawai untuk cTrader, alat yang kuat direka untuk membantu anda memvisualisasikan tren pasaran dengan ketepatan.
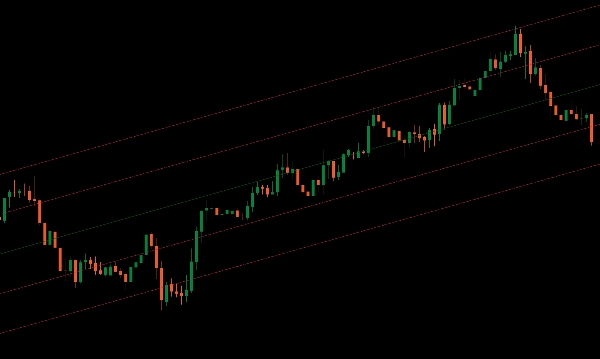
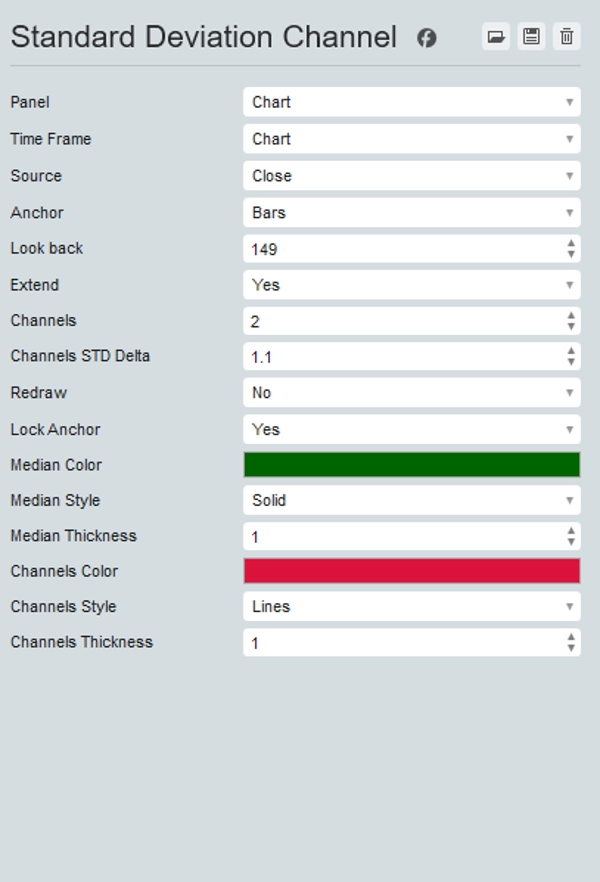
Penunjuk ini memaparkan median bagi tempoh yang ditetapkan pada carta anda, menyediakan titik rujukan pusat untuk pergerakan harga.
Selain itu, ia membolehkan anda menambah bilangan saluran atas dan bawah yang dikehendaki pada gandaan sisihan piawai, memberikan anda pandangan jelas tentang volatiliti harga dan zon pecahan potensi.
Sesuai untuk pedagang yang mencari keupayaan analisis yang dipertingkatkan, penunjuk Saluran Sisihan Piawai membantu anda mengenal pasti arah tren dan titik pembalikan potensi dengan mudah.
Tingkatkan alat dagangan anda dengan Saluran Sisihan Piawai untuk analisis pasaran dan pembuatan keputusan yang unggul.
Ringkasan
Ulasan pelanggan
5 | 100 % | |
4 | 0 % | |
3 | 0 % | |
2 | 0 % | |
1 | 0 % |


