
VWAP Volume Weighted Average Price
Indikator
Versi 1.0, Oct 2025
Windows, Mac
4.6
Ulasan: 3
Penerangan
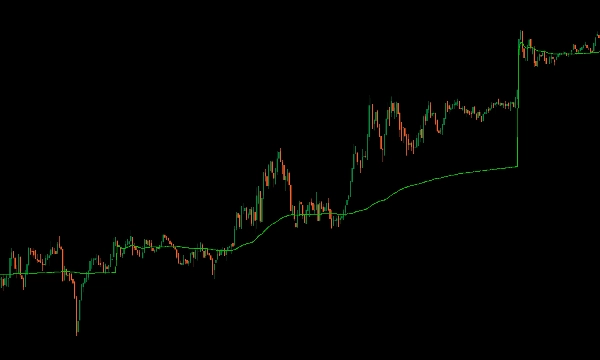
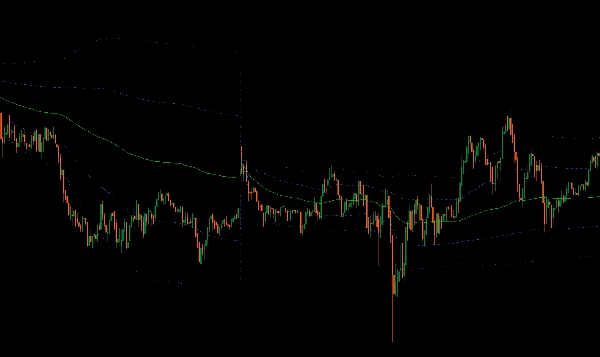
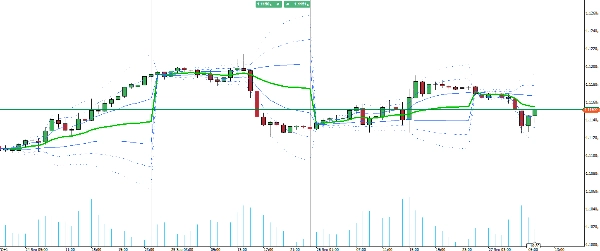
Memperkenalkan penunjuk VWAP untuk cTrader, membawa fungsi penuh Volume Weighted Average Price TradingView ke platform dagangan anda.
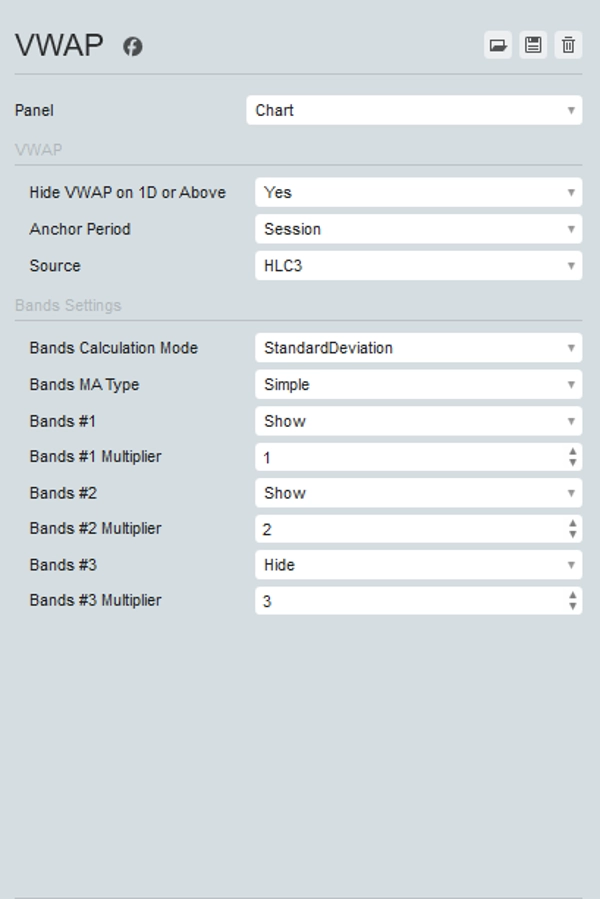
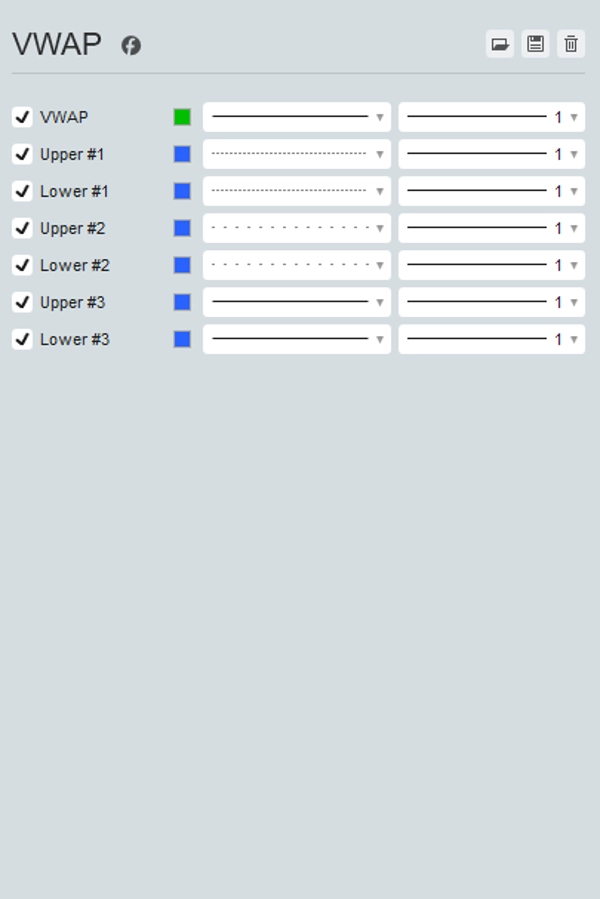
Alat komprehensif ini membolehkan anda memilih tempoh sauh anda (Sesi, Minggu, Bulan, Suku Tahun, Tahun) dan memilih daripada pelbagai sumber harga, termasuk Open, High, Low, Close, HL2, HLC3, OHLC4, dan HLCC4. Selain itu, ia boleh memaparkan sehingga tiga jalur sisihan piawai atas dan bawah, memberikan pandangan lengkap tentang taburan harga.
Penunjuk VWAP dikemas kini secara masa nyata dengan data tick, memastikan anda mempunyai pandangan yang paling tepat dan terkini untuk keputusan dagangan anda. Tingkatkan strategi dagangan anda dengan penunjuk VWAP yang serba boleh dan berkuasa dalam cTrader.
Ringkasan
Ringkasan AI
The VWAP (Volume Weighted Average Price) indicator for cTrader replicates the full functionality of TradingView's VWAP tool. It allows traders to select anchor periods including Session, Week, Month, Quarter, and Year, and choose from multiple price sources such as Open, High, Low, Close, HL2, HLC3, OHLC4, and HLCC4. The indicator also supports displaying up to three standard deviation bands above and below the VWAP line, providing insights into price distribution and volatility. It updates in real time with tick data, ensuring timely and accurate information for trading decisions. This indicator is applicable across various markets including Forex, Crypto, Stocks, Commodities, and Indices, and supports symbols like BTCUSD, EURUSD, GBPUSD, XAUUSD, NAS100, and USDJPY. It is suitable for strategies involving breakout and scalping techniques.
Profil indikator
Ulasan pelanggan
4.6
Ulasan: 3
5 | 67 % | |
4 | 33 % | |
3 | 0 % | |
2 | 0 % | |
1 | 0 % |
Ulasan pelanggan
October 27, 2025
Solid enough as a backup opinion. Win rate means less without average R.
October 22, 2025
it earns a spot because the trade idea gets a pause before execution. A clean signal can still fail.
October 19, 2025
The idea is fine, just do not expect it to print perfect entries, and The result needs a journal.
Perbincangan
Soalan Lazim
BTCUSD
Forex
Breakout
Indices
EURUSD
Commodities
GBPUSD
NZDUSD
Prop
Scalping
Crypto
Stocks
XAUUSD
NAS100
USDJPY
VWAP
Produk yang tersedia melalui cTrader Store, termasuk bot dagangan, indikator dan plugin, disediakan oleh pembangun pihak ketiga dan diberikan akses untuk tujuan maklumat dan teknikal sahaja. cTrader Store bukan broker dan tidak memberikan nasihat pelaburan, syor peribadi atau sebarang jaminan prestasi masa hadapan.


Harga
Sejak 25/09/2025
25
Jualan
331
Pemasangan percuma