
Mô tả
Ultimate Trend ADX là một phiên bản mạnh mẽ và tinh chỉnh của chỉ số Trung bình Động Hướng (ADX) cổ điển, được thiết kế để cung cấp cho nhà giao dịch cái nhìn rõ ràng hơn, năng động hơn về xu hướng và động lượng thị trường. Khác với ADX tiêu chuẩn, công cụ nâng cao này áp dụng các kỹ thuật làm mượt tiên tiến (EMA hoặc KAMA) và giới thiệu các tùy chọn tỷ lệ để làm cho các đường chỉ báo phản ứng nhanh hơn và có tác động thị giác mạnh mẽ hơn. Kết quả là một chỉ báo cấp chuyên nghiệp giúp bạn xác định các xu hướng mạnh, phát hiện sự đảo chiều và xác nhận các điểm vào lệnh với sự tự tin cao hơn.
Cách Đọc Chỉ Báo
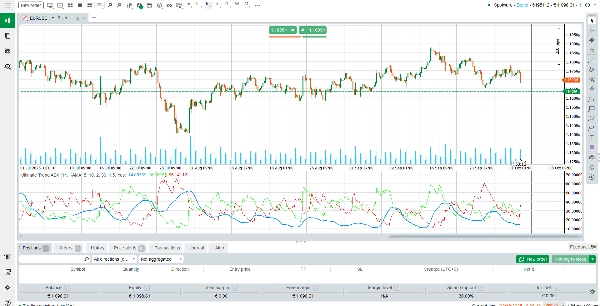
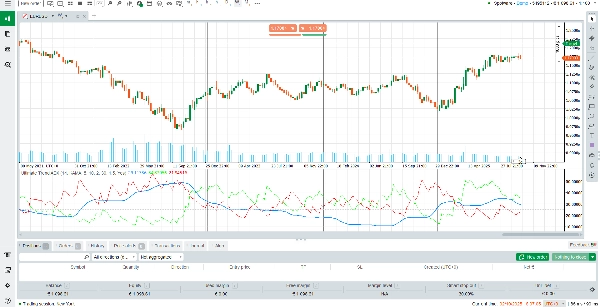
Ultimate Trend ADX hiển thị ba đường chính trong một cửa sổ riêng bên dưới biểu đồ của bạn:
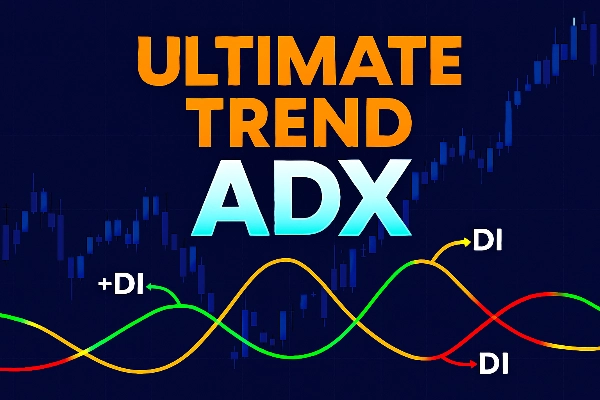
Đường ADX (Xanh Dương/Vàng): Đo lường sức mạnh tổng thể của xu hướng. ADX tăng cho thấy xu hướng đang mạnh lên, trong khi ADX giảm báo hiệu động lượng yếu đi. Giá trị trên 25 thường biểu thị một xu hướng mạnh.
Đường +DI (Xanh Lá): Đại diện cho chuyển động hướng lên của phe mua. Khi +DI nằm trên –DI, người mua đang kiểm soát.
Đường –DI (Đỏ): Đại diện cho chuyển động hướng xuống của phe bán. Khi –DI nằm trên +DI, người bán chiếm ưu thế trên thị trường.
Việc đọc các tín hiệu rất đơn giản:
Khi +DI cắt lên trên –DI và ADX đang tăng, điều đó cho thấy một xu hướng tăng mạnh.
Khi –DI cắt lên trên +DI và ADX đang tăng, đó là tín hiệu của một xu hướng giảm mạnh.
Khi ADX dưới mức 20–25, thị trường thường dao động hoặc thiếu hướng rõ ràng.
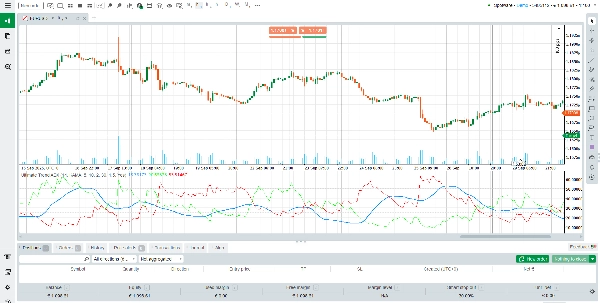
Chỉ báo cũng bao gồm các mức ngang tại 0, 25, 50, 75 và 100 để giúp bạn nhanh chóng đánh giá cường độ của xu hướng.
Cách Hoạt Động Của Chỉ Báo
Ultimate Trend ADX được xây dựng dựa trên Hệ Thống Chuyển Động Hướng tiêu chuẩn nhưng được nâng cấp với các thuật toán làm mượt hiện đại:
Trung Bình Động Lũy Thừa (EMA): Cung cấp tùy chọn làm mượt nhanh và nhạy cho các nhà giao dịch muốn nắm bắt động lượng ngắn hạn.
Trung Bình Động Thích Ứng của Kaufman (KAMA): Điều chỉnh linh hoạt theo biến động thị trường, lọc bỏ nhiễu trong điều kiện đi ngang đồng thời vẫn nhạy bén trong các xu hướng mạnh.
Hệ Số Tỷ Lệ cho +DI và –DI: Khuếch đại các đường xanh lá và đỏ, làm cho các tín hiệu tăng và giảm dễ nhìn thấy và dễ giải thích hơn trên biểu đồ.
Sự kết hợp này đảm bảo chỉ báo thích ứng với các môi trường thị trường khác nhau, mang lại cho bạn cả sự rõ ràng và chính xác.
Các Tính Năng Chính
Tính Toán ADX Nâng Cao – Sử dụng làm mượt EMA hoặc KAMA để đo lường sức mạnh xu hướng chính xác và thích ứng hơn.
Tín Hiệu Thị Giác Rõ Ràng – Mã màu sắc rõ ràng (xanh dương/vàng cho ADX, xanh lá cho +DI, đỏ cho –DI) giúp việc giải thích trở nên trực quan.
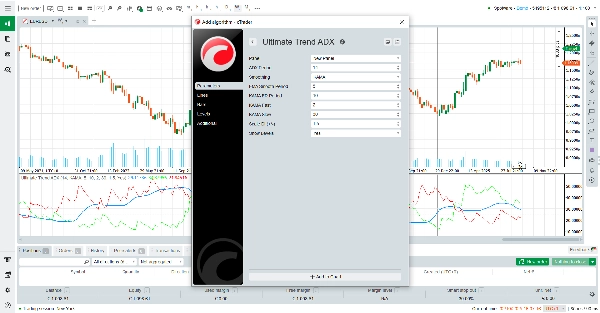
Độ Nhạy Có Thể Điều Chỉnh – Các tham số cho phép bạn tinh chỉnh độ phản ứng phù hợp với phong cách giao dịch của mình.
Các Mức Ngang Tích Hợp – Các mức tham chiếu nhanh (0/25/50/75/100) giúp bạn đánh giá ngay cường độ xu hướng.
Tại Sao Chọn Ultimate Trend ADX?
Thành công trong giao dịch thường phụ thuộc vào việc xác định khi nào thị trường đang có xu hướng và khi nào không. Ultimate Trend ADX mang lại cho bạn lợi thế đó bằng cách kết hợp độ tin cậy của ADX cổ điển với các cải tiến hiện đại giúp nó sắc nét hơn, rõ ràng hơn và dễ áp dụng hơn. Dù bạn giao dịch forex, cổ phiếu, chỉ số hay hàng hóa, chỉ báo này sẽ giúp bạn lọc bỏ nhiễu, xác nhận tín hiệu và duy trì sự đồng thuận với hướng đi chủ đạo của thị trường.
Tóm tắt
This indicator incorporates exponential moving average (EMA) or Kaufman’s adaptive moving average (KAMA) smoothing techniques to improve responsiveness and reduce noise. It also features a scaling factor for the +DI and –DI lines, enhancing signal visibility. Horizontal reference levels at 0, 25, 50, 75, and 100 assist in quickly assessing trend intensity.
Ultimate Trend ADX supports multiple markets including forex, stocks, indices, commodities, and cryptocurrencies. It is suitable for various trading strategies such as scalping, breakout, and grid trading. Adjustable sensitivity settings allow customization to fit different trading styles. This tool aids traders in identifying strong trends, spotting reversals, and confirming entry signals with improved clarity and precision.
Đánh giá của khách hàng
5 | 100 % | |
4 | 0 % | |
3 | 0 % | |
2 | 0 % | |
1 | 0 % |


