Mô tả
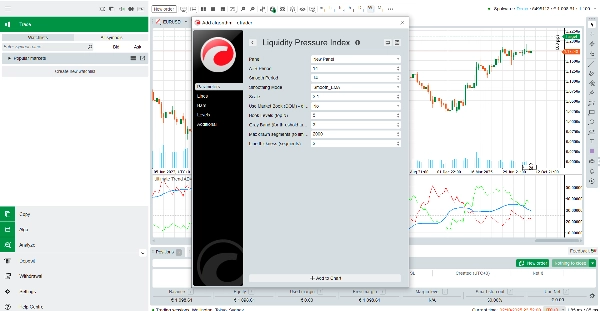
Chỉ số Áp lực Thanh khoản là một công cụ chuyên nghiệp được thiết kế để cung cấp cho các nhà giao dịch cái nhìn sâu sắc hơn về các động lực ẩn của thanh khoản thị trường. Khác với các bộ dao động truyền thống chỉ phản ứng với giá, Chỉ số Áp lực Thanh khoản kết hợp khối lượng tick, nén biến động và dòng hướng vào thành một đường duy nhất, dễ đọc. Điều này làm cho nó trở thành một người bạn đồng hành mạnh mẽ cho các nhà giao dịch muốn hiểu liệu áp lực mua hay bán thực sự đang chiếm ưu thế phía sau các cây nến.
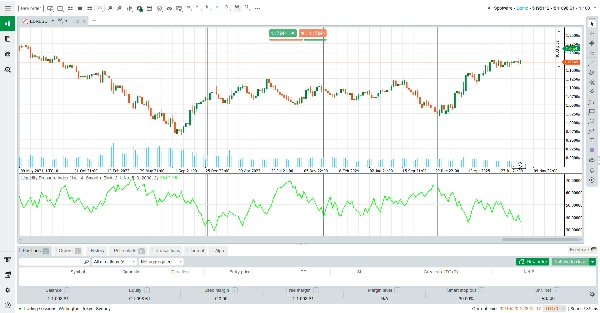
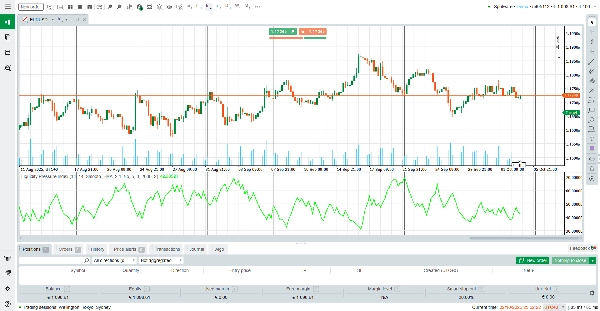
Về cơ bản, ALB tính toán sự cân bằng giữa thanh khoản mua tích lũy và thanh khoản bán tích lũy, chuẩn hóa kết quả dựa trên khối lượng tick cuộn. Kết quả được căn giữa quanh mức trung tính 50. Giá trị trên 50 cho thấy thanh khoản mua mạnh hơn, trong khi giá trị dưới 50 nhấn mạnh thanh khoản bán mạnh hơn.
Dấu hiệu trực quan đơn giản này cho phép các nhà giao dịch ngay lập tức đánh giá dòng lệnh cơ bản mà không cần phải giải thích nhiều chỉ báo cùng một lúc.
Cách Đọc Chỉ Báo
Đường trên 50: Thị trường cho thấy thanh khoản bên mua mạnh hơn. Điều này thường hỗ trợ sự tiếp diễn xu hướng tăng hoặc báo hiệu nhu cầu ẩn hấp thụ các lệnh bán.
Đường dưới 50: Thị trường cho thấy thanh khoản bên bán mạnh hơn. Điều này thường hỗ trợ sự tiếp diễn xu hướng giảm hoặc báo hiệu nguồn cung ẩn hấp thụ các lệnh mua.
Phẳng hoặc gần 50: Thanh khoản cân bằng, gợi ý sự do dự hoặc hợp nhất.
Tùy chọn làm mượt: Các nhà giao dịch có thể chọn giữa làm mượt EMA hoặc KAMA để giảm nhiễu và tập trung vào xu hướng thanh khoản chiếm ưu thế.
Cách Hoạt Động
Chỉ báo đầu tiên đo biến động phạm vi thực (ATR) và so sánh với phạm vi nến thực tế để ước tính sự nén. Sau đó, nó kết hợp với khối lượng tick để phân tách thanh khoản đang chờ xử lý (lệnh đang chờ trong sổ lệnh) với thanh khoản đã thực hiện (lệnh đã được khớp). Tùy thuộc vào hướng nến, thuật toán phân bổ sự hấp thụ mua hoặc bán ẩn. Cuối cùng, kết quả được chuẩn hóa dựa trên EMA cuộn của khối lượng tick, được tỷ lệ và làm mượt để rõ ràng hơn.
Kết quả là một chỉ số thanh khoản động thích ứng với điều kiện thị trường và tiết lộ cuộc đấu kéo giữa người mua và người bán trong thời gian thực.
Các Tính Năng Chính
Cái Nhìn Tập Trung Vào Thanh Khoản: Vượt ra ngoài giá để tiết lộ áp lực mua/bán ẩn.
Làm Mượt Thích Ứng: Lựa chọn giữa EMA hoặc KAMA để giảm nhiễu.
Tham Số Tùy Chỉnh: Kiểm soát chu kỳ ATR, độ dài làm mượt, tỷ lệ và độ dày đường.
Hiệu Suất Tối Ưu: Thiết kế nhẹ với giới hạn phân đoạn để đảm bảo biểu đồ mượt mà.
Tại Sao Nên Dùng Chỉ số Áp lực Thanh khoản?
Trong các thị trường di chuyển nhanh, chỉ giá có thể gây hiểu lầm. Advanced Liquidity Balance trang bị cho các nhà giao dịch một góc nhìn sâu sắc hơn, cho thấy liệu thị trường thực sự được hỗ trợ bởi thanh khoản hay các biến động đang diễn ra với sự tham gia yếu. Dù bạn là nhà giao dịch lướt sóng tìm kiếm sự mất cân bằng ngắn hạn hay nhà giao dịch swing xác nhận sức mạnh xu hướng, Chỉ số Áp lực Thanh khoản cung cấp một thấu kính thanh khoản chuyên nghiệp—và điều tuyệt nhất là nó hoàn toàn miễn phí.
Tải về ngay hôm nay và thêm một chiều rõ ràng mới cho các quyết định giao dịch của bạn.
Tóm tắt
Đánh giá của khách hàng
5 | 0 % | |
4 | 100 % | |
3 | 0 % | |
2 | 0 % | |
1 | 0 % |