
说明
🌟 **什么是Z分数?** 🌟
• **交易中的Z分数**:这是一种衡量当前价格距离其近期平均值有多远的方法,以标准差为单位表示。😊 值接近0表示价格接近其均值,而较高的值(正或负)😮 表示价格已经显著偏离。
• **统计用途**:这些数值可以帮助你识别价格“超买”📈或“超卖”📉的情况,这对均值回归策略或检测高波动时刻💥非常有用。
🌟 **指标如何工作** 🌟
1. **平均值和偏差的计算**:
- 分析一定数量的前期K线(或周期),计算平均收盘价及其标准差。🧮
- 利用这些数值确定当前价格偏离均值的程度。这个差异以Z分数表示。
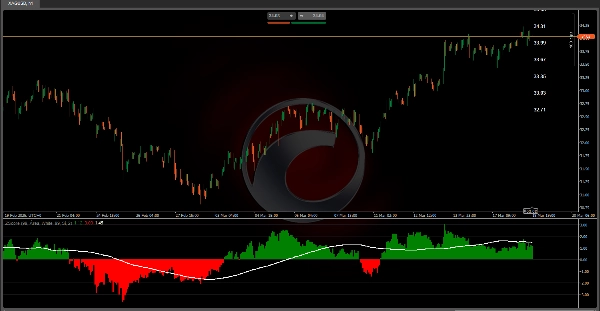
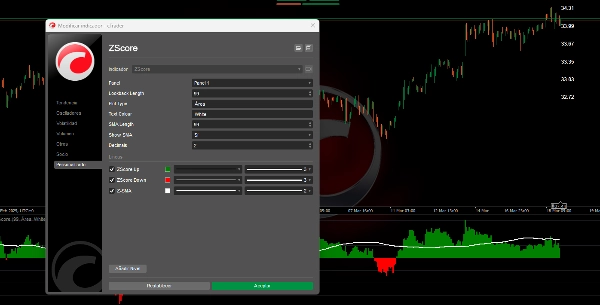
2. **Z分数的可视化**:
- **区域模式**:显示两个直方图:绿色🟩表示正值(价格高于均值时),红色🔴表示负值(价格低于均值时)。这让你可以直观识别偏差的大小和方向。
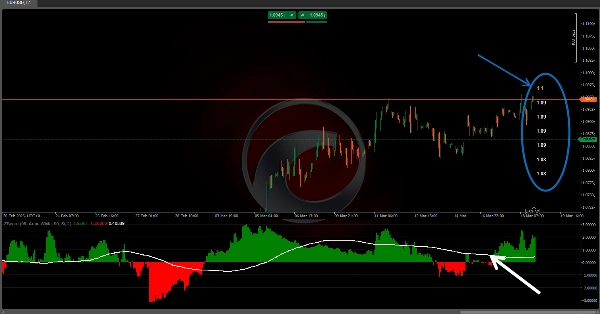
3. **Z分数的移动平均**:
- 对Z分数值计算移动平均。这有助于平滑波动,识别价格偏差随时间的趋势。📊
4. **概率区间和参考标签**:
- 此外,图表上会标注显示对应均值及各偏差水平的价格。这有助于理解市场行为在价格层面上的“极端”程度。⚠️
---
🌟 **交易者的解读与应用** 🌟
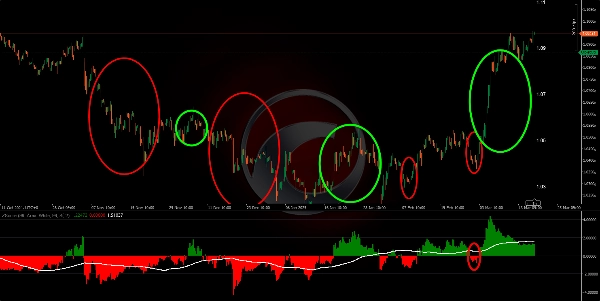
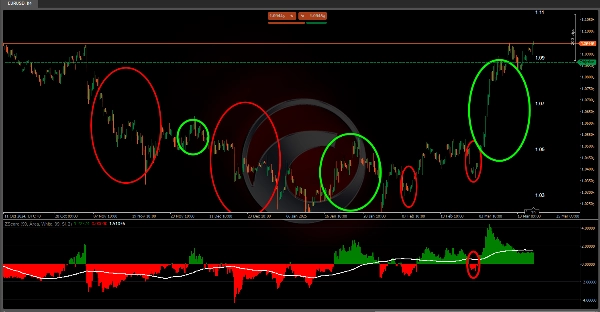
• **极端值检测**:通过观察指标中的极高或极低值,交易者可以识别价格已显著偏离其均值。这可能暗示价格即将修正(如果预期均值回归)🔄,或正在发生强劲突破。
• **趋势确认**:Z分数的移动平均及相关带状线可以帮助你观察价格行为趋势相对于均值的变化。线条的交叉或变化可被解读为入场🛡️或出场信号。
• **风险管理**:通过了解偏差水平和概率区间,你可以调整仓位大小或设定止损⬇️和止盈⬆️点位,因为你有了正常与极端波动的参考。
• **市场的统计理解**:除了作为图形工具外,该指标还鼓励以概率的角度思考市场行为。了解一个波动的“正常性”在评估交易机会时可能是决定性因素。🎯
🌟 **总结** 🌟
该算法将价格数据转换为统计表示,帮助可视化和量化价格相对于其近期行为的偏差。通过结合Z分数、移动平均、偏差带和概率表,指标提供了多层信息。这使其在识别市场处于异常状态的时刻尤为有价值,便于基于概率和统计做出入场🚀、出场🛑及风险管理决策。📈📉
Ctrader Store 指标:
Dynamic Market Structure
Analysis of Turning Points
Fibonacci Linear
Regression Multi-timeframe
Multi-Level Candle Bias
Tracker
Auto Support and
Resistance Trend Lines
摘要
客户评价
5 | 100 % | |
4 | 0 % | |
3 | 0 % | |
2 | 0 % | |
1 | 0 % |


