

present
가입하고 첫 구매 시 $50 할인을 받으세요
Trading product for Smart Liquidity Matrix 지표 Premium/Discount  Fair Value Gap, image 1
Smart Liquidity Matrix
지표
버전 1.0, Sep 2026
Windows, Mac
Trading product for Smart Liquidity Matrix 지표 Premium/Discount  Fair Value Gap, image 2
Trading product for Smart Liquidity Matrix 지표 Premium/Discount  Fair Value Gap, image 3
Trading product for Smart Liquidity Matrix 지표 Premium/Discount  Fair Value Gap, image 4
Trading product for Smart Liquidity Matrix 지표 Premium/Discount  Fair Value Gap, image 5
Trading product for Smart Liquidity Matrix 지표 Premium/Discount  Fair Value Gap, image 6
Trading product for Smart Liquidity Matrix 지표 Premium/Discount  Fair Value Gap, image 7
Trading product for Smart Liquidity Matrix 지표 Premium/Discount  Fair Value Gap, image 8
Trading product for Smart Liquidity Matrix 지표 Premium/Discount  Fair Value Gap, image 9
Trading product for Smart Liquidity Matrix 지표 Premium/Discount  Fair Value Gap, image 10
Trading product for Smart Liquidity Matrix 지표 Premium/Discount  Fair Value Gap, image 11

설명

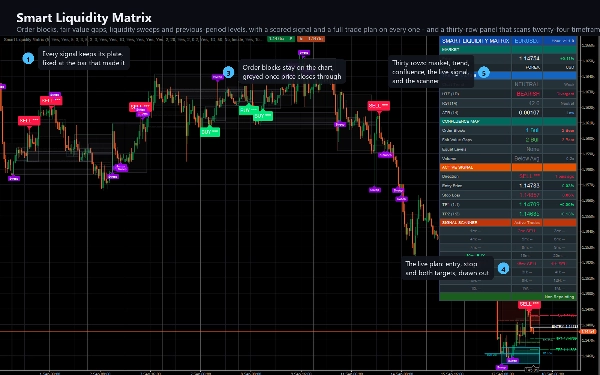
Smart Liquidity Matrix marks the structure that institutional order flow leaves behind, and keeps a

running read of the same setup across twenty four timeframes at once.


WHAT IT DRAWS


Order blocks. At every confirmed swing, the last opposite candle before the move is boxed. The zone

stays live until price closes through it, then greys out rather than disappearing, so you can still

see where it was.


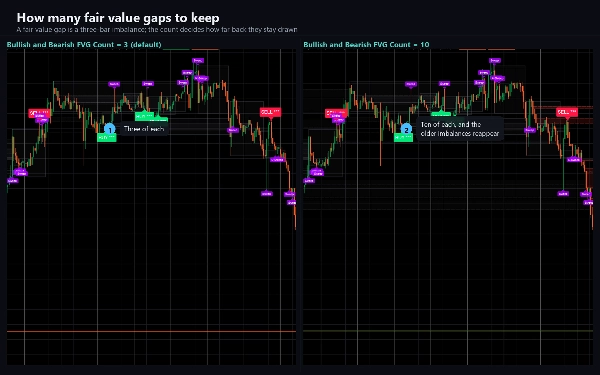
Fair value gaps. Three-bar imbalances, drawn the moment they form and greyed when price closes back

through them.


Equal highs and lows. Swings that match within a tenth of the current ATR are joined with a dotted

level and tagged EQH or EQL. These are the pools that liquidity sweeps hunt.


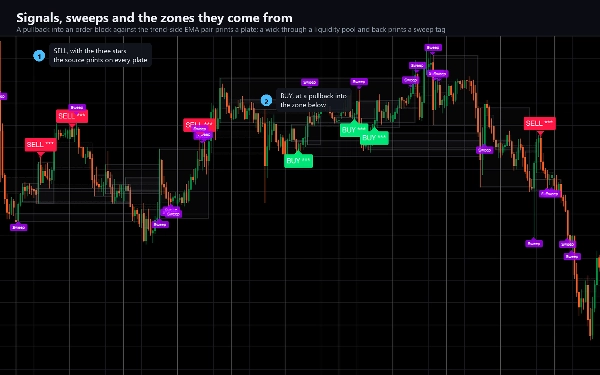
Liquidity sweeps. When price wicks through an equal level or the previous period high or low and

closes back inside, the bar is marked. Each sweep can raise an alert.


Previous period levels and equilibrium. The previous day high and low, drawn with their own glow,

plus the fifty percent line between the current swing high and low.


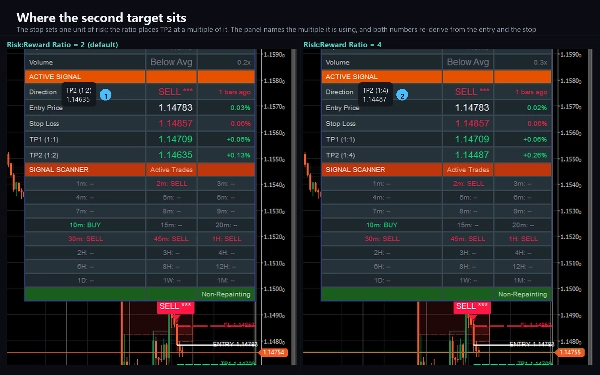
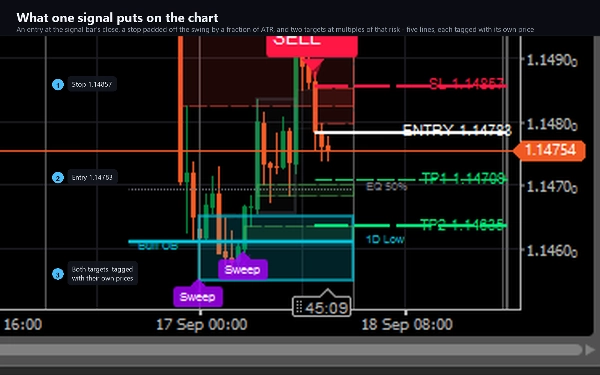
Buy and sell signals with a risk picture. A pullback entry against the trend-side EMA pair, with the

entry, stop and two targets drawn out to the right of the bar and labelled with their prices.


THE SCANNER


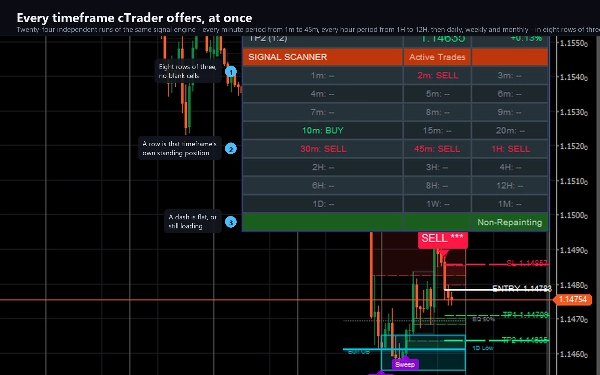
The lower third of the dashboard runs the same signal logic on twenty four timeframes

independently, from one minute to one month, and prints whether each one currently holds a long, a

short, or nothing. Agreement across neighbouring rows is the point: a sell showing on thirty minutes,

forty five minutes and one hour together reads very differently from a lone signal on a single row.


Those twenty four are every standard time period cTrader offers: one, two, three, four, five, six,

seven, eight, nine, ten, fifteen, twenty, thirty and forty five minutes, then one, two, three, four,

six, eight and twelve hours, then daily, weekly and monthly. Every one is read from the same bar data

as the chart, so nothing here depends on your broker tick history, and they fill eight rows of three

exactly with no empty cells.


THE DASHBOARD


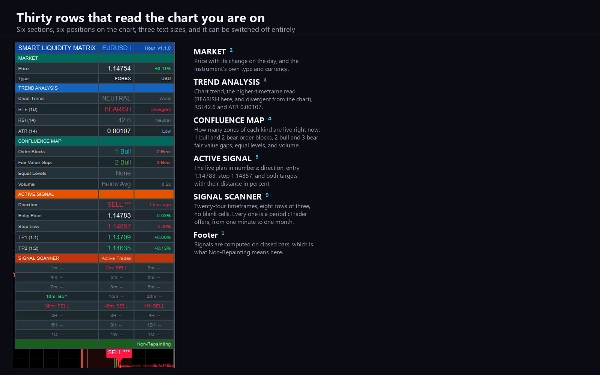
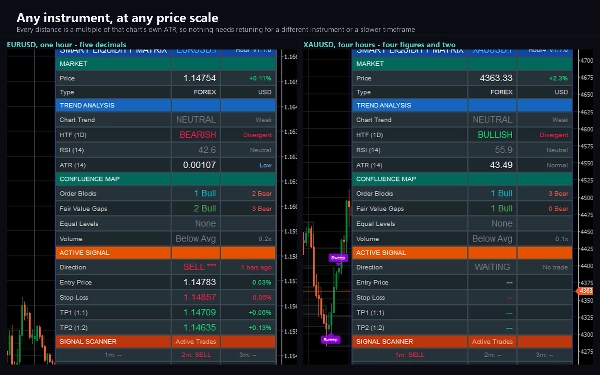
Thirty rows in six sections: market, trend analysis, confluence map, active signal, the

scanner, and a footer. Six positions, three text sizes, and it can be switched off entirely. The row

pitch is tuned for a cTrader chart pane, which is typically shorter than a browser chart.


ALERTS AND AUTOMATION


Log, sound and e-mail alerts on signals, structure events and sweeps, deduplicated so one bar raises

one message. A built-in webhook posts the same events as JSON to any address you choose, through

cTrader own networking service, so a bot or a journal can act on them. It stays off until you enter

an address, never fires while the indicator is loading history, never fires in a backtest, and is

rate limited.


The indicator requests no elevated permissions. It cannot read your files or start a process.


SETTINGS


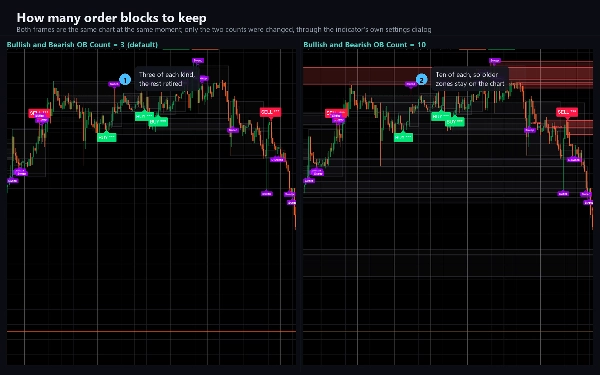
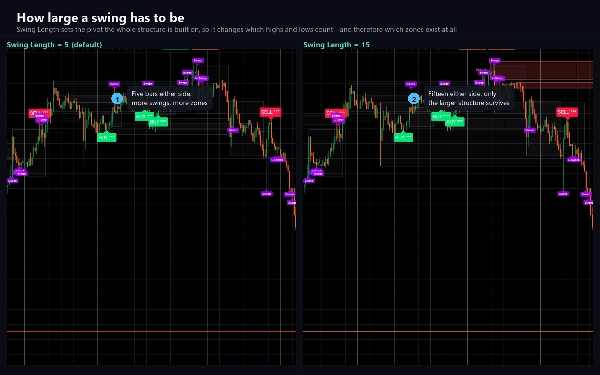
Seventy parameters in sixteen groups. Every zone count, colour, timeframe and label position is

adjustable, and a Lite Mode thins every line for a cleaner chart.


SUITABLE FOR


Forex, indices, metals and crypto CFDs. Any timeframe; the defaults were set on one hour. The

scanner section is most informative between five minutes and four hours.


WHAT IT DOES NOT DO


It does not place, modify or close orders. It is an analysis and alerting tool. Signals are computed

on closed bars only and do not repaint.


Trading involves risk. Past performance does not guarantee future results.

요약

AI 요약
Smart Liquidity Matrix is a market structure indicator designed for use on cTrader charts, supporting Forex, indices, metals, and crypto CFDs across all timeframes. It identifies and visually marks key institutional order flow features such as order blocks, fair value gaps, equal highs and lows, liquidity sweeps, and previous period levels. Order blocks highlight the last opposite candle before confirmed swings, while fair value gaps show three-bar imbalances. Equal highs and lows are connected to indicate liquidity pools targeted by sweeps, which are marked when price wicks beyond these levels but closes back inside. The indicator also displays buy and sell signals with entry, stop, and target levels based on trend-side EMA pullbacks.

A unique feature is its 24-timeframe signal scanner, which independently analyzes from one minute to monthly intervals, showing long, short, or neutral signals to identify multi-timeframe agreement. The dashboard organizes information into six sections including market data, trend analysis, confluence, active signals, and the scanner, optimized for cTrader’s chart pane.

Alerts can be configured for signals, structure events, and sweeps, with options for log, sound, email, and webhook notifications for automation or journaling. The indicator uses closed bars only and does not repaint. It offers extensive customization with seventy adjustable parameters and a Lite Mode for cleaner visuals. It does not execute trades but serves as an analytical and alerting tool.
지표 프로필
지표 카테고리
시장 구조 (SMC)
출력 유형
신호
데이터 요구 사항
막대만
지원되는 신호
돌파
반전
레벨 터치
레벨 돌파

고객 리뷰

0.0
리뷰: 0
고객 리뷰
이 상품에 대한 리뷰가 아직 없습니다. 이미 사용해 보셨나요? 다른 사람들에게 가장 먼저 소개해 주세요!

상담

자주 묻는 질문(FAQ)

Premium/Discount
Fair Value Gap
Key Levels
Liquidity Sweep
Order Block
Market Structure
Liquidity Grab
트레이딩 봇, 지표, 플러그인 등 cTrader Store에서 제공되는 상품은 제3자 개발자에 의해 제공되며, 이는 단순히 정보 및 기술적 접근을 목적으로 제공된 것입니다. cTrader Store는 중개인이 아니며, 투자 조언, 개인별 추천 또는 향후 성과에 대한 어떠한 보장도 제공하지 않습니다.

이 작성자의 상품 더 보기

지표
ATR
CCI
+4
A trend line that never steps back, a shaded band to the price, and a pointer at the swing where the trend turns.
지표
ADX
ATR
+5
SuperTrend signals scored on five confluence factors, with an ATR stop, three targets and a dashboard.
지표
ADX
ATR
+5
Ten confluence layers scored on every closed bar, with an anti-chop gate, pivot levels and a live dashboard.
지표
ATR
RSI
+4
RSI bands drawn on price, confluence-scored BUY/SELL signals, an ATR stop with three targets
지표
Volume
Channel
+3
A higher-timeframe log-regression channel with a volume profile, Point of Control and session levels.
지표
Volume
Key Levels
+1
Fixed-grid volume profile: bull and bear volume at every price level, with Point of Control and value area.
지표
ATR
BOS
+5
Know how strong each Supertrend flip is: scored BUY/SELL, structure stop + 3 targets, live win-rate dashboard, alerts.
지표
ATR
EMA
+3
EMA trend, RSI reclaim and divergence signals with ATR stop and two targets, swing levels and a 16-row dashboard.
지표
ATR
EMA
+2
Eight-EMA ribbon with ATR trade zones, a nine-symbol screener and a five-timeframe trend dashboard.
지표
ADX
ATR
+5
EMA-cross signals scored on six confluence layers, with an ATR stop, three targets and a live panel
지표
ADX
ATR
+5
Range-filter BUY/SELL flips with an ATR or swing stop, three targets, five confluence stars and a live panel
지표
ATR
EMA
+4
Range-filter BUY/SELL signals scored by four confluence layers, with a stop, five targets and a trend panel

좋아하실 만한 다른 항목

지표
📊 Smart Floating Risk Pro – Advanced Risk Management for cTrader
지표
RSI
VegaXLR's cTrader StochRSI identifies overbought/oversold RSI levels for precise trade entries.
지표
ATR
EMA
+4
Range-filter BUY/SELL signals scored by four confluence layers, with a stop, five targets and a trend panel
지표
Volume
Channel
+5
Spots volatility squeezes before they fire — the compression phase everyone else misses.
지표
Prop
Scalping
Shows bars from different Time Frame on zoom out and hides the current bars. Perfect tool for Multi TF "Market Reply"
지표
ATR
RSI
+5
Supply and demand zones with break of structure, higher timeframe MA signals, a percent stop and three targets.
지표
ATR
SMC
+18
Super Wick detects powerful candle rejections: fractal long-wicks, HTF resonance zones, and a WSI gauge.
지표
ATR
Key Levels
+1
See both sides of the trade before you take either one.
"AutoAVWAP" 로고
최고 평점
4.5
(4)
$19
/
$25
지표
Prop
VWAP
+11
The best automatic anchored VWAP indicator every trader can get help from.
지표
RSI
BTCUSD
+5
Traders Dynamic Index (TDI) — Divergence Edition
지표
ATR
RSI
+6
💹 Define a price channel 📈 and determine trend direction (bullish 🟢 or bearish 🔴).
지표
The long awaited new and improved Supply Demand Premium V2 indicator. Unlock greater trading opportunities now!
지표
ATR
Forex
+11
Elliott Wave 2 indicator with Markov probability analysis and a confidence score to assess Wave 3 continuation quality.
지표
Forex
BTCUSD
+4
This indicator is designed to perform multiple non-linear regression analysis using four independent variables.
지표
RSI
EURUSD
+2
It identifies areas of market imbalance (Fair Value Gaps or FVGs) and projects them on the chart in a smart way
지표
Key Levels
Support & Resistance
Clean psychological round-number grid with native pip and point auto-scaling across Forex, Gold, Indices, and Crypto.
지표
EMA
AI-assisted
+1
Multi EMA Timeframes lets you stay on your chart and see the exact EMA from any timeframe you choose — up to 5 at once.
지표
AI
Forex
+5
Dynamic, color‑coded candles reveal market shifts instantly—spot momentum and trend reversals at a glance

가격

3
판매



























