

설명
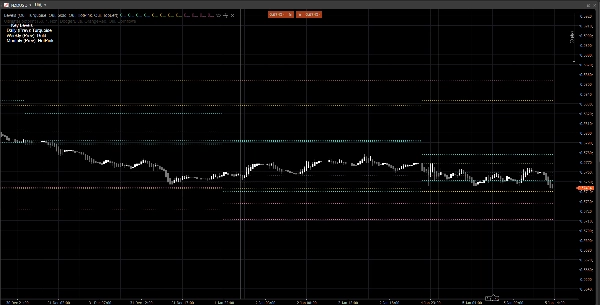
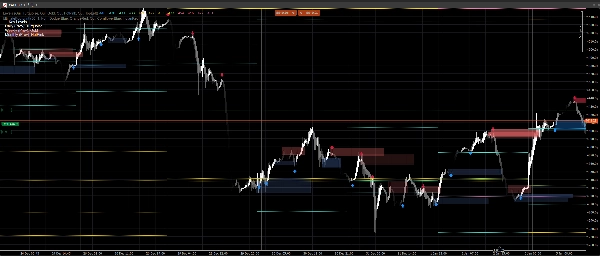
Price Action Zones는 차트에 이전 일간, 주간 및 월간 주요 레벨을 직접 표시하는 가볍고 노이즈 없는 지표입니다.
다음 항목을 표시합니다:
- 이전 일: 고가 / 저가 / 시가 / 종가
- 이전 주: 고가 / 저가 / 시가 / 종가
- 이전 월: 고가 / 저가 / 시가 / 종가
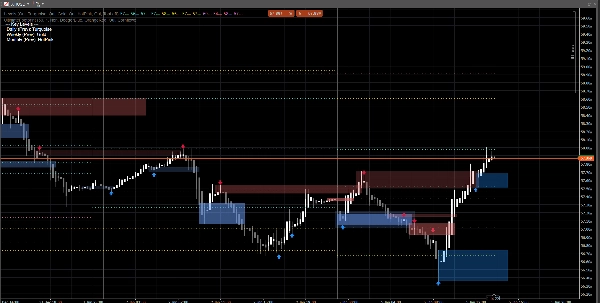
이 레벨들은 시장 구조, 진입, 목표 및 위험 배치에 대한 반응 구역, 유동성 참조, 그리고 컨텍스트 앵커로 널리 사용됩니다.
유용한 이유
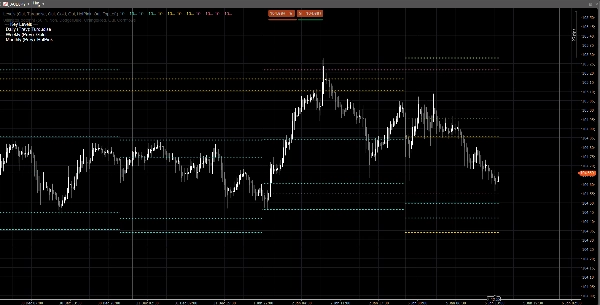
- 차트를 전환하지 않고도 상위 시간대 참조 레벨을 즉시 확인할 수 있습니다
- PDH/PDL, PWH/PWL, PMH/PML을 중심으로 일중 가격 움직임을 구성하는 데 도움을 줍니다
- 깔끔한 시각적 표현: 현재 세션/주/월 동안 레벨이 일정하게 유지됩니다
- 모든 심볼과 시간대에서 작동합니다
사용자 설정
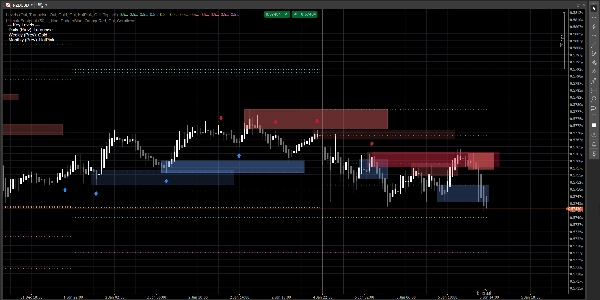
각 시간대를 독립적으로 토글할 수 있습니다:
- 일간 / 주간 / 월간 표시
- 각 그룹에 대해 사용자 지정 색상 설정
- 선택 가능한 코너 위치가 있는 간단한 범례 활성화
기술적 참고사항
- 레벨은 이전에 완료된 일간/주간/월간 캔들(현재 형성 중인 캔들이 아님)을 사용하여 계산됩니다.
- 이로 인해 리페인팅이 방지되고 세션 동안 레벨이 안정적으로 유지됩니다.
면책 조항
이 지표는 차트 작성 및 의사 결정 지원 용도로만 제공됩니다. 매수/매도 신호를 생성하지 않으며 금융 조언이 아닙니다. 항상 위험을 관리하고 자신의 데이터로 검증하십시오.
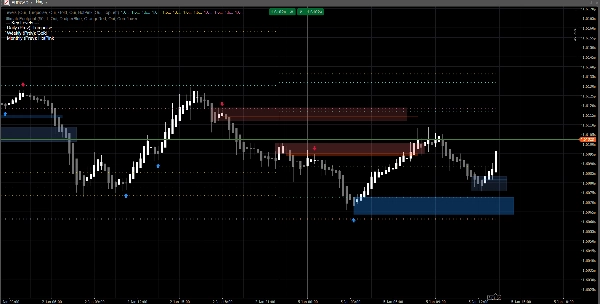
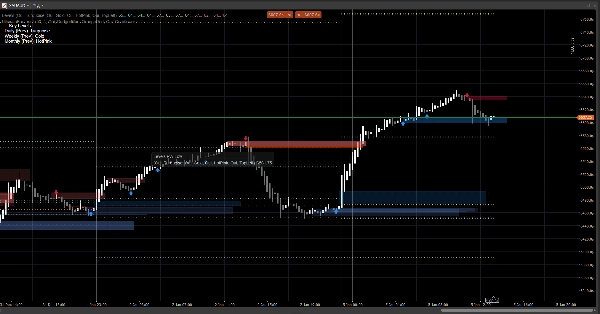
차트의 신호는 제 프로필에서 제공하는 Ultimate Footprint 지표에 의해 생성됩니다.
요약
지표 프로필
고객 리뷰
0.0
리뷰: 0
고객 리뷰
이 상품에 대한 리뷰가 아직 없습니다. 이미 사용해 보셨나요? 다른 사람들에게 가장 먼저 소개해 주세요!
상담
자주 묻는 질문(FAQ)
Prop
Forex
Indices
Commodities
Crypto
Stocks
트레이딩 봇, 지표, 플러그인 등 cTrader Store에서 제공되는 상품은 제3자 개발자에 의해 제공되며, 이는 단순히 정보 및 기술적 접근을 목적으로 제공된 것입니다. cTrader Store는 중개인이 아니며, 투자 조언, 개인별 추천 또는 향후 성과에 대한 어떠한 보장도 제공하지 않습니다.


가격
가입일 23/07/2025
6.91M
거래량
27.63K
핍 수익
877
무료 설치