
STC
Indikator
278 downloads
Version 1.0, Jan 2025
Windows, Mac
5.0
Bewertungen: 2
Beschreibung
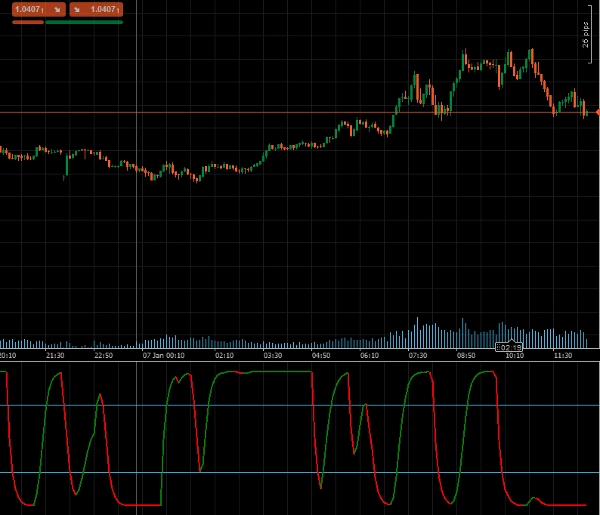
Der Schaff Trend Cycle (STC), entwickelt vom renommierten technischen Analysten Doug Schaff, ist ein fortschrittlicher Handelsindikator, der entwickelt wurde, um Markttrends und Umkehrungen mit außergewöhnlicher Geschwindigkeit und Präzision zu identifizieren. Basierend auf der innovativen Idee, Trend- und Zykluskomponenten zu kombinieren, nutzt der STC exponentielle gleitende Durchschnitte (EMAs) und stochastische Berechnungen, um die Einschränkungen von nachlaufenden Indikatoren wie MACD oder Stochastik-Oszillator zu überwinden. Dieser einzigartige Ansatz liefert frühere, zuverlässigere Handelssignale und bietet einen erheblichen Vorteil bei der Trenddetektion und Marktanalyse.
Hauptmerkmale:
- Frühe Trend-Erkennung: Kombiniert exponentielle gleitende Durchschnitte (EMAs) mit stochastischen Berechnungen, um Trends schneller zu erfassen.
- Anpassbare Einstellungen: Länge, schnelle MA, langsame MA, MA-Typ und Glättungsfaktor können an Ihre Handelsstrategie angepasst werden.
- Visuelle Warnungen: Dynamische Farbwechsel zeigen bullische oder bärische Trends an, was die Interpretation der Marktbedingungen erleichtert.
- Unterstützung für überkaufte/überverkaufte Niveaus: Eingebaute Niveaus (25 und 75) helfen, potenzielle Wendepunkte des Marktes zu identifizieren.
Parameter
- Länge: Definiert die Anzahl der Perioden für die Trendberechnung.
- Länge der schnellen MA: Legt die Länge des schnellen gleitenden Durchschnitts fest.
- Länge der langsamen MA: Gibt die Länge des langsamen gleitenden Durchschnitts an.
- MA-Typ: Ermöglicht die Auswahl des Typs des gleitenden Durchschnitts (z. B. EMA, SMA).
- Glättungsfaktor: Passt den Glättungsfaktor für verfeinerte Trendsignale an.
Ausgaben
- STC: Gibt den primären Schaff Trend Cycle-Wert aus, der die Trendrichtung und -stärke darstellt, zur programmgesteuerten Verwendung in automatisierten Handelssystemen.
- STCBull: Hebt bullische Trendbedingungen hervor.
- STCBear: Hebt bärische Trendbedingungen hervor.
Zusammenfassung
Indikatorprofil
Kundenbewertungen
5.0
Bewertungen: 2
5 | 100 % | |
4 | 0 % | |
3 | 0 % | |
2 | 0 % | |
1 | 0 % |
Kundenbewertungen
August 12, 2025
Pros: Fast and accurate trend detection, earlier signals than MACD, customizable levels. Cons: No alerts, no MTF mode, no trade statistics.
Diskussion
Häufig gestellte Fragen (FAQ)
MACD
Über den cTrader Store verfügbare Produkte, einschließlich Handelsbots, Indikatoren und Plugins, werden von externen Entwicklern bereitgestellt und nur zu Informations- und technischen Zugriffszwecken verfügbar gemacht. cTrader Store ist kein Broker und erbringt keine Anlageberatung, persönlichen Empfehlungen oder eine Garantie für zukünftige Performance.
Mehr von diesem Autor


![„[Stellar Strategies] MARSI Signal Plotter“-Logo](https://cdn.ctrader.com/image/webp/7b2b8da6-8f8e-4646-8d4a-4710c516c01e_25567)


Preis
Seit 24/09/2024
4.47K
Kostenlose Installationen