
PDHL
Indikator
1.84K downloads
Version 1.0, Sep 2024
Windows, Mac
2.5
Bewertungen: 2
Beschreibung
Einführung des High-Low Trading Indikators
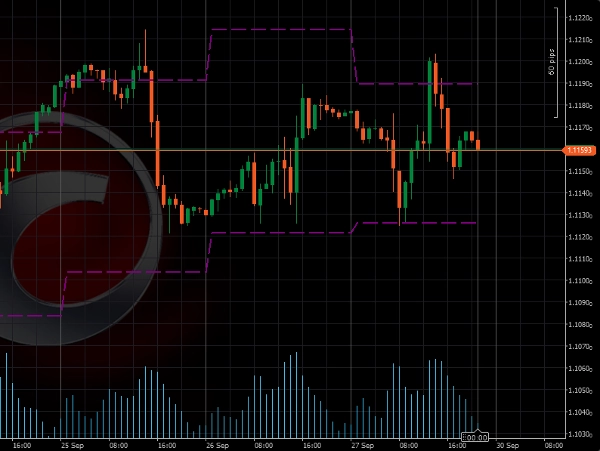
Dieser Indikator ist dafür konzipiert, automatisch die höchsten und niedrigsten Kursniveaus des Vortages in Ihrem Chart darzustellen. Dieses Tool hilft Ihnen, schnell wichtige Niveaus für potenzielle Ausbrüche und Umkehrungen zu identifizieren.
Hauptvorteile:
- Ideal für Breakout-Trading: Dieser Indikator hebt kritische Kursniveaus des Vortages hervor, die oft als Bezugspunkte für Breakout-Strategien verwendet werden. Das Trading von Ausbrüchen oberhalb oder unterhalb dieser Niveaus kann hochpotenzielle Setups bieten.
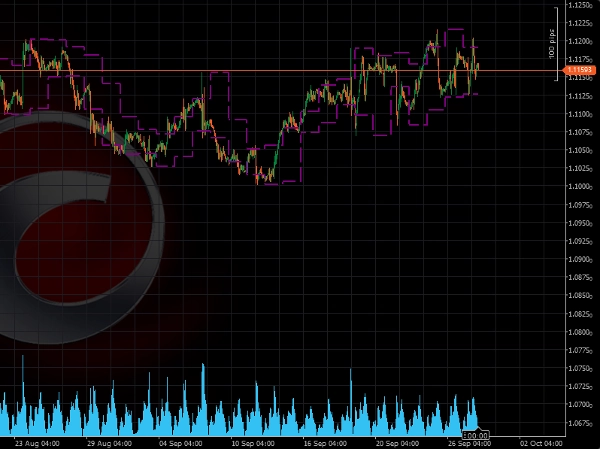
- Einfach, aber effektiv: Der High-Low Trading Indikator konzentriert sich auf einen der wichtigsten Aspekte der Kursbewegung – das Hoch und Tief des Vortages. Durch die Einbeziehung dieser Niveaus in Ihre Strategie erhalten Sie ein klareres Verständnis der Marktstruktur und potenzieller Wendepunkte.
Hinweise:
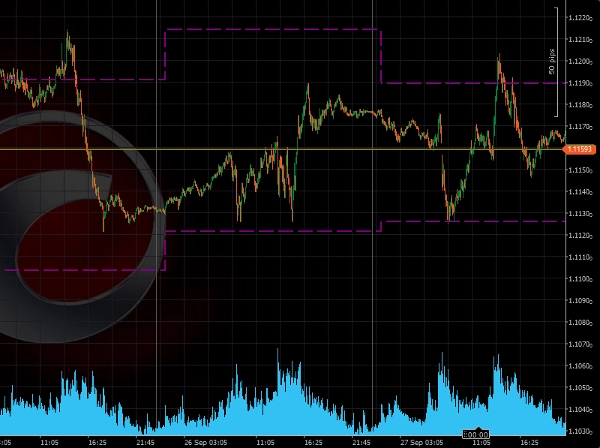
- Am besten auf Zeitrahmen unter 1 Tag verwenden
Einstellungen:
- Sonntag einbeziehen: Standard = nein
Zusammenfassung
KI-Zusammenfassung
The PDHL (Previous Day High & Low) indicator automatically plots the prior day's highest and lowest price levels on trading charts. It is designed to assist traders in identifying key price levels that may signal potential breakouts or reversals. By highlighting these critical levels, the indicator supports breakout trading strategies, providing reference points for entering trades when price moves above or below the previous day's range. The tool emphasizes simplicity and effectiveness by focusing on essential price action elements, helping traders better understand market structure and potential turning points. It is best used on intraday timeframes shorter than one day. A configurable setting allows users to include or exclude Sunday in the calculation, with the default setting excluding it.
Indikatorprofil
Kundenbewertungen
2.5
Bewertungen: 2
5 | 0 % | |
4 | 0 % | |
3 | 50 % | |
2 | 50 % | |
1 | 0 % |
Kundenbewertungen
October 9, 2025
What Timezone is it in at default? It seems to fail to get the accurate Highs and lOws for different istruments. You could add that as a customisable input. Please add closing price too
July 9, 2025
Pros: Simple and clear display of previous day's high/low levels. Stable performance. Easy to use and customize. Cons: No breakout alerts. No visual zone fill option. Lacks additional filters or Fibo levels.
Diskussion
Häufig gestellte Fragen (FAQ)
Breakout
Über den cTrader Store verfügbare Produkte, einschließlich Handelsbots, Indikatoren und Plugins, werden von externen Entwicklern bereitgestellt und nur zu Informations- und technischen Zugriffszwecken verfügbar gemacht. cTrader Store ist kein Broker und erbringt keine Anlageberatung, persönlichen Empfehlungen oder eine Garantie für zukünftige Performance.
Mehr von diesem Autor


Das könnte Sie auch noch interessieren


Preis
Seit 24/09/2024
4.46K
Kostenlose Installationen