

present
Registrati e ricevi uno sconto da $50 sul tuo primo acquisto
Trading product for MyZTrade High TF candle v1.0 Indicatore Inside Bar Engulfing, image 1
MyZTrade High TF candle v1.0
Indicatore
Versione 1.0, Aug 2026
Windows, Mac
Trading product for MyZTrade High TF candle v1.0 Indicatore Inside Bar Engulfing, image 2
Da 28/06/2025

Descrizione

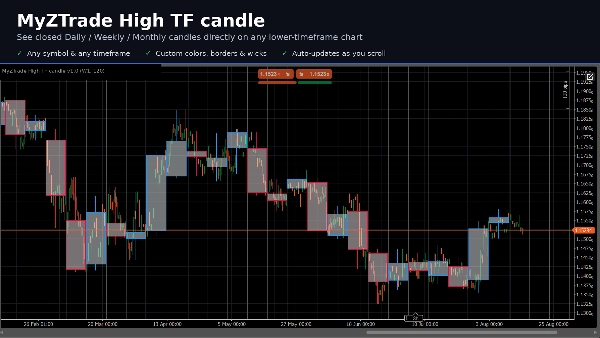
MyZTrade High TF candle è uno strumento di visualizzazione multi-timeframe che sovrappone le candele completate di timeframe superiore (Giornaliero, Settimanale o Mensile — selezionabile) direttamente sul tuo grafico attuale come riquadri colorati con un corpo, un bordo e stoppini alti/bassi, simile a vedere una candela D1 o W1 senza cambiare grafico.

Vengono disegnate solo le candele di timeframe superiore chiuse. La candela ancora in formazione viene intenzionalmente saltata, quindi un riquadro non cambia mai forma mentre il suo periodo è ancora aperto — appare solo una volta che il periodo è completamente chiuso.

Tipo di indicatore: sovrapposizione multi-timeframe / strumento di contesto price-action. Funziona su qualsiasi simbolo e qualsiasi timeframe inferiore (es. M15, H1, H4).

Caratteristiche principali:

  • Il timeframe superiore è selezionabile: Giornaliero, Settimanale o Mensile
  • Il numero di riquadri visibili è configurabile, così il caricamento del grafico rimane sotto controllo su storici lunghi
  • Colori separati per riempimento e bordo per candele rialziste e ribassiste
  • Stoppini alti/bassi opzionali su ogni riquadro
  • Ridisegna automaticamente quando scorri il grafico

Casi d'uso nel trading: leggere zone di supporto/resistenza di timeframe superiore e bias giornaliero o settimanale mentre si esegue su un timeframe inferiore, e studiare come il prezzo si comporta all'interno di un intervallo di timeframe superiore completato senza dover cambiare grafici avanti e indietro.

Riepilogo

Riepilogo AI
MyZTrade High TF candle is a multi-timeframe visualization indicator designed to overlay completed higher-timeframe candles—Daily, Weekly, or Monthly—directly onto a lower timeframe chart (e.g., M15, H1, H4). It displays these higher timeframe candles as colored boxes with distinct bodies, borders, and optional high/low wicks, providing a clear view of higher timeframe price action without switching charts. Only fully closed higher timeframe candles are shown, ensuring that the displayed boxes remain static and do not change shape during the current period. Users can configure the number of visible boxes to manage chart load and customize separate fill and border colors for bullish and bearish candles. The indicator automatically redraws when scrolling the chart. This tool aids traders in identifying higher timeframe support and resistance zones and assessing daily or weekly market bias while executing trades on lower timeframes. It supports any symbol and serves as a price-action context tool for enhanced multi-timeframe analysis.
Profilo indicatore

Recensioni dei clienti

0.0
Recensioni: 0
Recensioni dei clienti
Questo prodotto non ha ancora ricevuto recensioni. L'hai già provato? Fallo sapere agli altri per primo!

Discussioni

Domande frequenti

Inside Bar
Engulfing
Fair Value Gap
BOS
Imbalance
CHOCH
Support & Resistance
I prodotti disponibili tramite cTrader Store, inclusi bot di trading, indicatori e plugin, sono forniti da sviluppatori terzi e resi disponibili esclusivamente a scopo informativo e di accesso tecnico. cTrader Store non è un broker e non fornisce consulenze in materia di investimento, raccomandazioni individualizzate o garanzie di risultati futuri.

Altro da questo autore

Indicatore
Volume
Key Levels
+4
Margin Zones its CME-based support/resistance levels from price extremes, helps traders spot entries and exits NKZ zones
Indicatore
Channel
Fibonacci
+5
Market maker levels from key price extremes — catch major reversals and corrections in one click. ver1.2
Indicatore
ATR
EMA
+5
The indicator displays potential reversal zones (support/resistance) on the chart based on the average range (High–Low)

Potrebbe interessarti anche

Indicatore
ZigZag
Indices
+2
Auto Trendlines, Fibonacci, Pitchfork and Patterns from non‑repainting pivots. One‑click Presets, targeted Alerts, and a
Indicatore
It draws a step line that visualize the movement of H4. Particularly effective when trade on lower timeframe.
Indicatore
Forex
BTCUSD
+4
The Linear Regression Oscillator (LRO) is a technical indicator based on linear regression analysis.
Indicatore
BOS
Key Levels
+1
Guided by Yahuah Yahusha. 15M: BOS above red (buys)/below green (sells). 4HC reject+BOS. 5M: RBS/SBR. SL wick. TP 1:4.
Indicatore
Key Levels
Market Structure
+1
HTF Candle Projector displays the current Higher Timeframe candle (4H or 1H) as a real projected candle LIVE..
Indicatore
AI
SMC
+5
Complete ICT Killzones: 5 sessions, easy colors, transparency controls & session info. Professional timing for cTrader.
Indicatore
Forex
Alerts you when price touches Fibonacci levels. Stay organized and trade efficiently!
Indicatore
Prop
Scalping
Shows bars from different Time Frame on zoom out and hides the current bars. Perfect tool for Multi TF "Market Reply"
Indicatore
ATR
Volume
+5
Order blocks with measured hold-rate stats and confidence scoring — not just zones on a chart.
Indicatore
Forex
cTrader Auto Support & Resistance detects key levels with Fibonacci analysis and sends real-time trading alerts.
Indicatore
Auto-detect supply & demand zones, remove broken levels, and trade smarter with real-time alerts. Precision made simple.
Indicatore
BOS
CHOCH
+5
BOS/CHoCH signals confirmed by liquidity sweep + FVG confluence, with a live conviction score.
Indicatore
AI-assisted
Order Block
+5
The daily bias estimator indicator uses ICT concepts to show whether the chart is bullish or bearish on multi-time frame
Indicatore
RSI
MACD
This indicator is a combination of MACD and RSI into one. This is perfect fusion and powerful indicator ever.
Indicatore
Doji
Engulfing
+3
Multi Timeframe OHLC levels (daily, weekly, and monthly), with a two-day price action bias dashboard
Indicatore
ATR
RSI
+19
Multi-timeframe heatmap scoring Direction, Strength & Volatility at a glance!
Indicatore
ATR
Breakout
Detects swing highs/lows, structure, breakouts, trend lines, and fibs — great for price action trading.
Indicatore
Indices
Breakout
+1
You can use the cTrader Pivot Points Pro indicator to find a good pullback entry in a trend

Prezzo

Da 28/06/2025




















