
Descrição
VERSÃO ESTENDIDA DISPONÍVEL — AQUI
Você está visualizando a versão original. A versão estendida deste indicador foi lançada com recursos adicionais:
- Exibição de Idade Aprimorada: Formato anos, meses, semanas, dias (ex.: "3a 2s 4d")
- Mostrar Todos os FVGs: Defina "FVG para Exibir" como -1 para mostrar FVGs históricos ilimitados
- Estender FVGs Preenchidos: Opção para estender caixas de FVG preenchidas até a barra atual
- Níveis de Fibonacci: Níveis automáticos (23,6%, 38,2%, 50%, 61,8%, 78,6%) em FVGs parciais e preenchidos
- Limite de Preenchimento Parcial: Limite personalizável (50-99%, padrão 90%)
__________________________________________________________________________________________
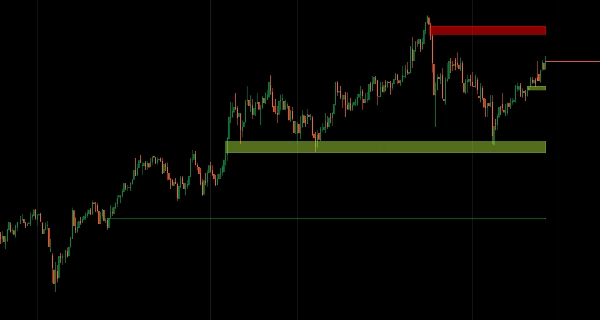
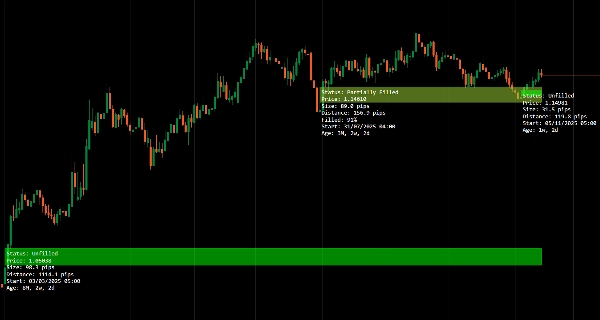
Identifique Fair Value Gaps com rastreamento de idade e monitoramento do status de preenchimento.
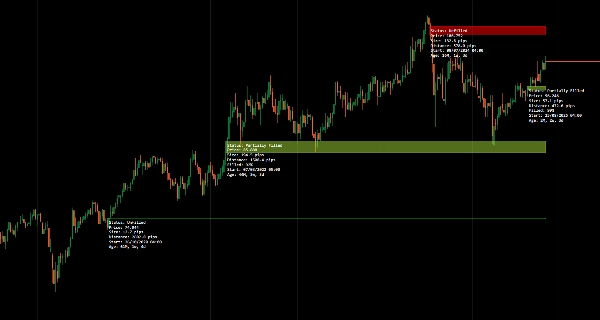
Detecta automaticamente gaps de alta e baixa, acompanha seu comportamento de preenchimento (não preenchido, parcial, totalmente preenchido) em tempo real e exibe a idade do gap para priorização.
Varredura em múltiplos períodos para alinhar gaps estruturais de HTF com a ação de preço de LTF, atualizações dinâmicas de status conforme o preço interage com as zonas, e rotulagem mínima e não intrusiva oferecem análise focada de desequilíbrio de liquidez para traders que buscam preenchimento de gaps e entradas baseadas em estrutura.
RECURSOS
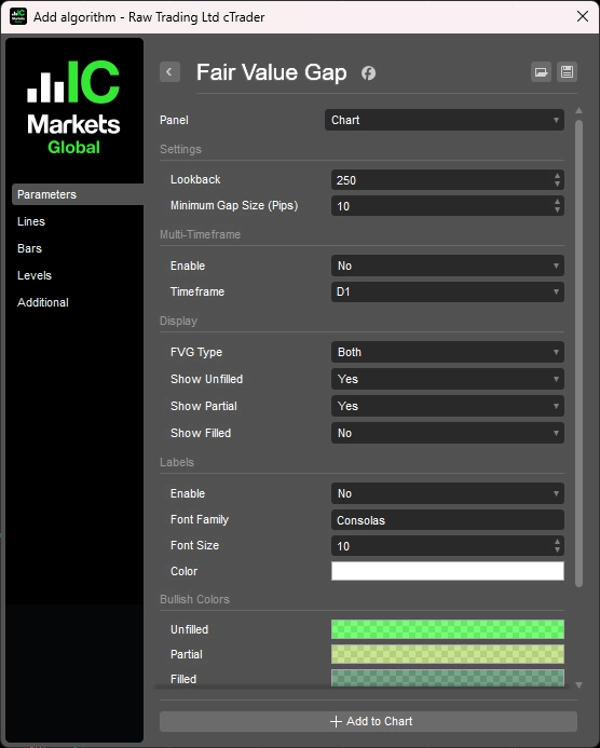
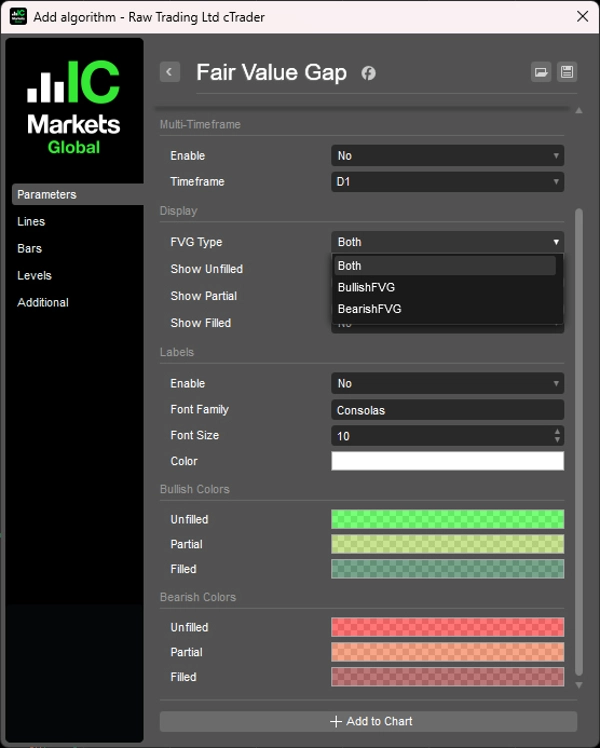
Identificação de FVG
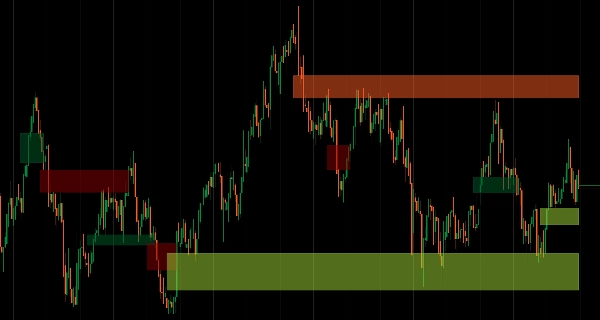
- Detecta automaticamente Fair Value Gaps de alta e baixa
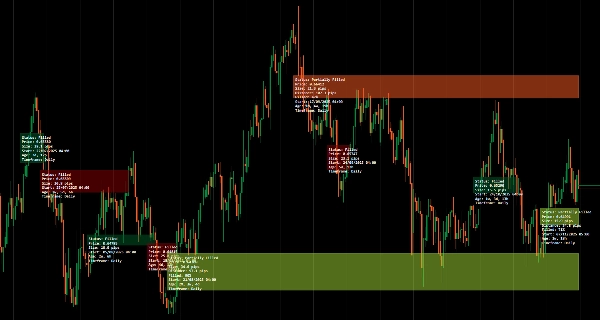
- Acompanha status não preenchido, parcialmente preenchido e totalmente preenchido em tempo real
- Plotagem visual limpa com mínimo excesso de informações no gráfico
Rotulagem de Idade
- Exibe quanto tempo passou desde a formação de cada gap
- Ajuda a priorizar gaps frescos versus antigos para seleção de trades
- Contexto temporal melhora a tomada de decisão sobre a relevância do gap
Rastreamento de Status
- Mostra status atual de preenchimento: não preenchido, parcialmente preenchido ou totalmente preenchido
- Atualiza dinamicamente conforme o preço interage com o gap
- Confirmação visual da captura de liquidez
Modo Multi-Período
- Varre e exibe FVGs de períodos superiores em gráficos de períodos inferiores
- Alinha gaps estruturais de HTF com a ação de preço de LTF
- Melhora o fluxo de trabalho de análise multi-período
Interface Limpa e Minimalista
- Rótulos não intrusivos projetados para clareza
- Informativo sem poluir sua visualização de preço
- Apresentação profissional para análise focada
__________________________________________________________________________________________
MAIS INDICADORES GRATUITOS
Explore uma ampla gama de ferramentas de análise de mercado — desde estrutura e volume até regressão, volatilidade e períodos personalizados.
O código-fonte está disponível no repositório GitHub.
Todos gratuitos para uso. Mas se quiser enviar um suporte para café, você pode fazer isso aqui.
Suporte/Resistência
Volume
- Perfilador de Atividade de Volume
- Analisador de Eficiência de Volume
- Análise de Perfil de Volume
- Perfil de Volume - Atualizado
- Análise de Spread de Volume
- VWAP (Preço Médio Ponderado por Volume)
Médias Móveis
- Média Móvel Ancorada
- Média Móvel Escalonada por Desvio
- Linha de Tendência Instantânea
- Média Móvel Adaptativa de Kaufman com Visão de Tendência
- Canal de Média Móvel
- Conjunto de Médias Móveis
- Média Móvel de Canal de Tendência
Utilitários/Personalizados
Baseado em Regressão
Volatilidade
Osciladores
__________________________________________________________________________________________
ISENÇÃO DE RESPONSABILIDADE
Negociar envolve riscos. Este indicador destina-se apenas à análise técnica — sempre aplique gestão de risco adequada e negocie com responsabilidade.
FEEDBACK E MELHORIAS
Se você tiver sugestões, pedidos de recursos ou ideias para melhorias, por favor deixe um comentário na aba Discussão. Seu feedback ajuda a melhorar o indicador para todos.
Resumo
Avaliações de clientes
5 | 100 % | |
4 | 0 % | |
3 | 0 % | |
2 | 0 % | |
1 | 0 % |


