
Descrição
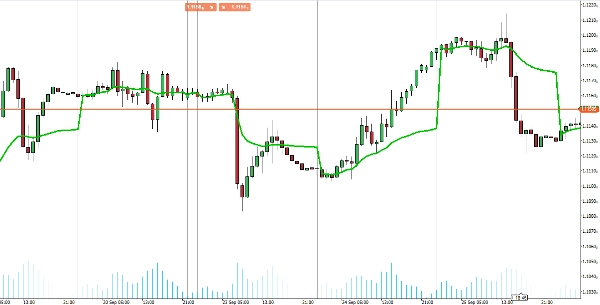
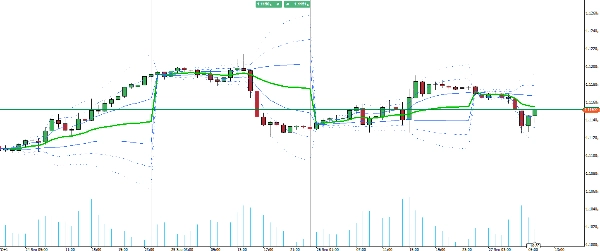
Apresentando o VWAP indicador para cTrader, trazendo toda a funcionalidade do Preço Médio Ponderado por Volume do TradingView para a sua plataforma de negociação.
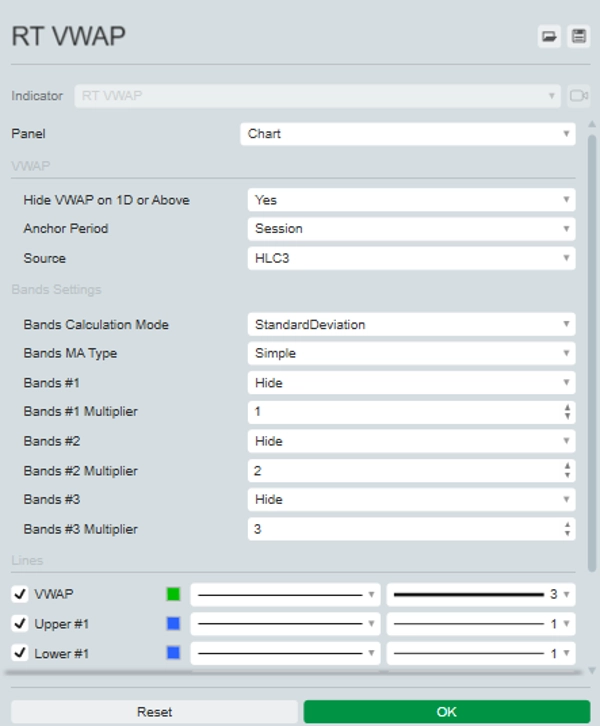
Esta ferramenta abrangente permite que você escolha seu período âncora (Sessão, Semana, Mês, Trimestre, Ano) e selecione entre várias fontes de preço, incluindo Abertura, Máxima, Mínima, Fechamento, HL2, HLC3, OHLC4 e HLCC4. Além disso, pode exibir até três bandas superiores e inferiores de desvio padrão, proporcionando uma visão completa da distribuição de preços.
O indicador VWAP atualiza em tempo real com dados de ticks, garantindo que você tenha as informações mais precisas e oportunas para suas decisões de negociação. Eleve sua estratégia de negociação com o versátil e poderoso indicador VWAP no cTrader.


