説明
🚀 10,000人以上のトレーダーがすでに私たちのTOP インジケーター🏆
👉 すべてのTOPシステムはこちらから入手できます:
_______________________________________________
📌 マーケット構造インジケーター
· ✅ AdvancedMarket Structure: Bos, Choch, SwinLevels, Order Blocks, Market Structure& Liquidity Finder
· 🔄 Dynamic Market StructureAnalysis of Turning Points
· 🧱 Order Block
· ⚖️ Market Imbalance
· ⛓️ BOS & CHOCH
· 🧠 ICT Power of 3
_______________________________________________
🔚 スマートエグジットシステム
_______________________________________________
📐 ジグザグインジケーター
· 🔍 ZigZag Price LiquidityProjection
· ➖ ZigZag
_______________________________________________
🧱 サポート&レジスタンスインジケーター
· 🟩 SmartTrend Support &Resistance Lines
· 🧱 All Support and ResistanceLevels
_______________________________________________
📊 トレンド&チャネルインジケーター
· 📊 Supertrend
_______________________________________________
💧 ボリューム&流動性ツール
_______________________________________________
⚡ モメンタム&RSIインジケーター
· 🔎 Multi-Level Candle Bias
Tracker
_______________________________________________
🔮 予測&投影ツール
· 📐 Prediction Based on Linreg& ATR
· 📏 Fibonacci Linear RegressionMulti-timeframe
· 📈 Volume-Powered Market Flow Projector
📊 スクイーズブレイクアウト回帰システム -🚀
🎯 それは何で、何のため? ❓
このインジケーターは、相補的な2つのシステムを組み合わせて、高確率のトレード機会を特定します:
- スクイーズシステム(ボラティリティ圧縮):🔍 市場が「圧縮」され、どの方向にも爆発しそうな瞬間を検出します 💥
- トレンドチャネルシステム(線形回帰):📈 支配的なトレンドとその動的なサポート/レジスタンスの限界を示します
🔍 どのように機能しますか? ⚙️
パート1:スクイーズ検出
インジケーターは上位の時間枠(デフォルト:日足)を分析し、レンジ(高値と安値の差)が最小のローソク足を探します:
• 7期間 = 「ショートスクイーズ」(短期圧縮)
• 10期間 = 「エクステンデッドスクイーズ」(拡張圧縮 - より強力)💪
スクイーズを検出すると何が起こるのか?
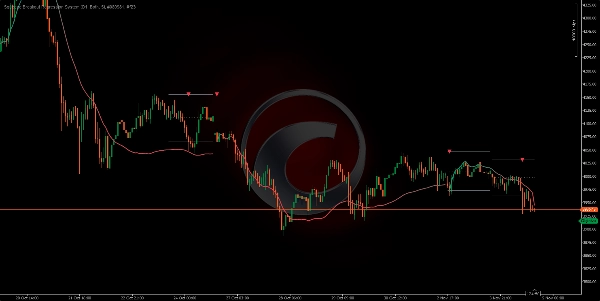
- 3本の水平線を描きます:
o 上線 = レジスタンス(上方向に突破すべきレベル)↗️
o 下線 = サポート(下方向に突破すべきレベル)↘️
o 中央の点線 = ピボット(中間点)⚖️ - ブレイクアウトを待ちます:
o 価格がレジスタンスを上に突破した場合 → ブルシグナル(緑の三角形)🟢
o 価格がサポートを下に突破した場合 → ベアシグナル(赤の三角形)🔴
スマートフィルター:🧠
• ブルシグナルの場合:価格は最初にピボットの下にあり、その後上昇する必要があります
• ベアシグナルの場合:価格は最初にピボットの上にあり、その後下降する必要があります
• これにより、価格がすでにレンジから遠い場合の誤シグナルを排除します ❌
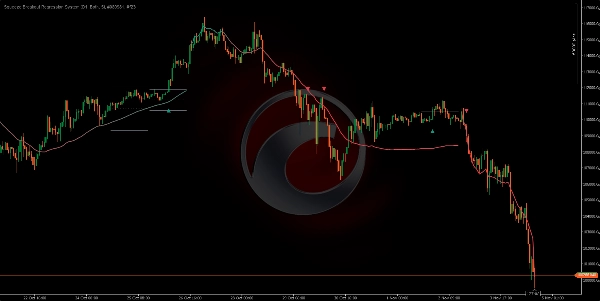
パート2:回帰トレンドチャネル
線形回帰を用いて最適なトレンドラインを数学的に計算し、以下を持つ動的チャネルを描きます:
• 太い中央線(上昇中は緑、下降中は赤)🎨
- ブレイクアウトアラート 🚨
ブレイクアウトシグナルを表示
• 機能:シグナル三角形の表示/非表示
• 影響:無効にすると矢印は表示されませんが、ボックスと線は表示されたままです
• 推奨:常に有効 ✅
ブル/ベアブレイクアウトカラー
• 機能:ブル/ベアシグナルの色を変更
• 影響:視覚的なみで検出には影響なし
• 推奨:ブルは緑、ベアは赤(標準)🟢🔴 - トレンドチャネル(Trend Channel)📊
チャネル方式
• オプション:ローリング / スタティック
• 機能:
o ローリング:バーごとにチャネルが適応(流動的)🔄
o スタティック:期間開始時に一度チャネルを描き、延長(直線)➖
• 影響:ローリングはより動的、スタティックは初期トレンドが見やすい
• 推奨:リアルタイム追跡にはローリング ⌚
アンカータイプ
• オプション:周期的 / 最初のバー
• 機能:
o 周期的:新しい期間ごとに計算をリセット(週次、月次など)📅
o 最初のバー:チャートの最初のバーから計算(リセットなし)🏁
• 影響:周期的は各期間ごとにクリーンなチャネルを提供、最初のバーは全体トレンドを表示
• 推奨:構造化された分析には周期的 🧱
チャネル期間
• 機能:チャネル計算のリセット頻度
• デフォルト:週次(Weekly)🗓️
• 影響:
o 短期間(日次)→チャネルが頻繁に変わり、急激な変化に追従
o 長期間(月次)→より安定したチャネルで基調トレンドを表示
• 推奨:週次が最適なバランス ⚖️
価格ソース
• オプション:終値 / 始値 / 高値 / 安値 / 典型価格 / 加重平均
• 機能:チャネル計算に使用する価格
• 影響:終値が最も一般的(クローズ価格)、典型価格は計算を平滑化
• 推奨:精度には終値、平滑化には典型価格 🎯
偏差乗数
• 機能:標準偏差を乗算してチャネルの幅を調整
• デフォルト:1.0
• 影響:
o 低値(0.5-0.8)→狭いチャネル、タッチシグナルは多いが誤シグナルも増加
o 高値(1.5-2.0)→広いチャネル、タッチは少ないが信頼性が高い
• 推奨:1.0が最適なバランス ⚖️ - チャネルカラー 🎨
動的カラー
• 機能:トレンドに応じてチャネルの色を変更(上昇中は緑、下降中は赤)
• 影響:無効にすると1色のみ使用(上昇トレンドカラー)
• 推奨:トレンドを素早く識別するために有効 🚦
上昇/下降トレンドカラー
• 機能:上昇/下降トレンドの色を定義
• 影響:視覚的なみ
• 推奨:緑/赤(クラシック)🟢🔴
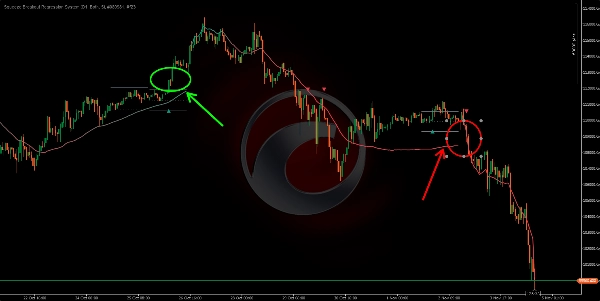
🟢 ロングオペレーション 📈
- スクイーズ検出:
• 3本の水平線が表示される(サポート、ピボット、レジスタンス)
• 価格はこれらのレベル間で圧縮されている - ブレイクアウト準備:
• 価格はピボット(中央の点線)の下にある
• これにより、ブルのブレイクアウトを探す条件が有効になる - 重要な合流点 - エントリーモーメント:🎯
• ✅ 緑の三角形が表示される(ブルのブレイクアウト確定)🟢
• ✅ 回帰チャネルが緑(上昇トレンド確定)📗
• ✅ 価格が上部のスクイーズラインを突破 ↗️
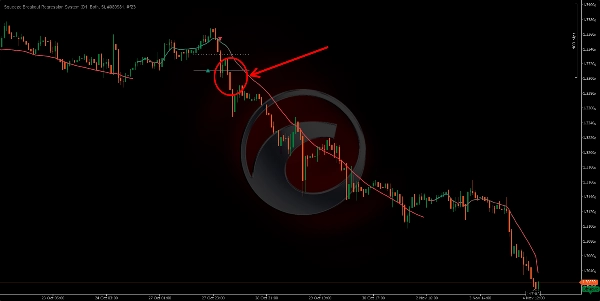
🔴 ショートオペレーション 📉
- スクイーズ検出:
• 再び3本の水平線が表示される
• 新しい圧縮ゾーンが特定される - ベアブレイクアウト準備:
• 価格はピボット(点線)の上にある
• これにより、ベアのブレイクアウトを探す条件が有効になる - 重要な合流点 - エントリーモーメント:🎯
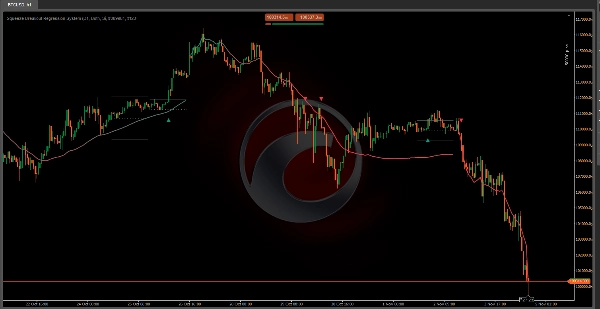
• ✅ 赤の三角形が表示される(ベアのブレイクアウト確定)🔴
• ✅ 回帰チャネルが赤(下降トレンド確定)📕
• ✅ 価格が下部のスクイーズラインを突破 ↘️
概要
The Trend Channel System uses linear regression to calculate the dominant trend and dynamically draws a channel with color-coded trend direction (green for uptrend, red for downtrend). It offers configurable options such as rolling or static channels, periodic or continuous anchoring, channel period, price source, and deviation multiplier to adjust channel width and responsiveness.
The indicator supports breakout alerts with visual signals for bullish and bearish breakouts, aiding traders in timing entries. It is applicable across various markets including Forex, cryptocurrencies, stocks, and indices, with symbols like BTCUSD, EURUSD, GBPUSD, XAUUSD, NAS100, and USDJPY. The system integrates volatility compression detection with trend analysis to assist in identifying breakout trading opportunities.