
Opis
SC Market Structure
SC Market Structure to wizualny wskaźnik struktury rynku zaprojektowany do automatycznego identyfikowania i wyświetlania najważniejszych lokalnych maksimów i minimów bezpośrednio na wykresie.
Wskaźnik nieustannie analizuje ruch cenowy i mapuje ewolucję struktury rynku, łącząc istotne maksima i minima za pomocą dynamicznych linii struktury. Pozwala to traderom natychmiast rozpoznać kierunek trendu, kontynuację trendu oraz potencjalne punkty odwrócenia bez ręcznego oznaczania ruchów rynkowych.
Dodatkowo SC Market Structure automatycznie klasyfikuje każdy nowy punkt strukturalny, korzystając ze standardowych definicji struktury rynku:
- HH (Higher High)
- HL (Higher Low)
- LH (Lower High)
- LL (Lower Low)
Łącząc automatyczne wykrywanie ruchów z etykietowaniem struktury rynku w czasie rzeczywistym, traderzy mogą szybko zrozumieć, czy rynek jest w trendzie, konsolidacji, czy wykazuje oznaki potencjalnego odwrócenia trendu.
Kluczowe cechy
• Automatyczne wykrywanie istotnych lokalnych maksimów i minimów
• Dynamiczne linie struktury łączące punkty zwrotne rynku
• Automatyczna identyfikacja Higher Highs (HH)
• Automatyczna identyfikacja Higher Lows (HL)
• Automatyczna identyfikacja Lower Highs (LH)
• Automatyczna identyfikacja Lower Lows (LL)
• Jasna wizualizacja byczej i niedźwiedziej struktury rynku
• Natychmiastowe rozpoznawanie kontynuacji trendu i wzorców odwrócenia
• Działa na wszystkich rynkach i ramach czasowych
• Czysta i intuicyjna prezentacja wykresu
Wizualizacja struktury rynku
SC Market Structure nieustannie ocenia ruchy cenowe i oznacza każdy nowo potwierdzony punkt strukturalny.
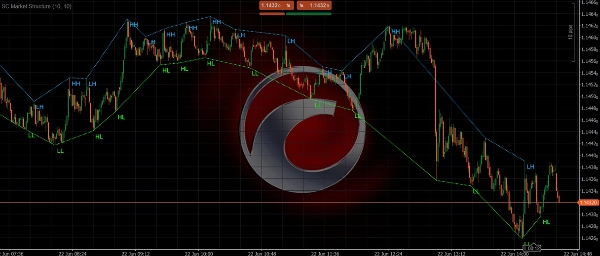
Struktura bycza
Struktura bycza jest identyfikowana, gdy cena tworzy:
• Higher Highs (HH)
• Higher Lows (HL)
Ta sekwencja wskazuje, że kupujący pozostają w kontroli, a trend wzrostowy nadal trwa.
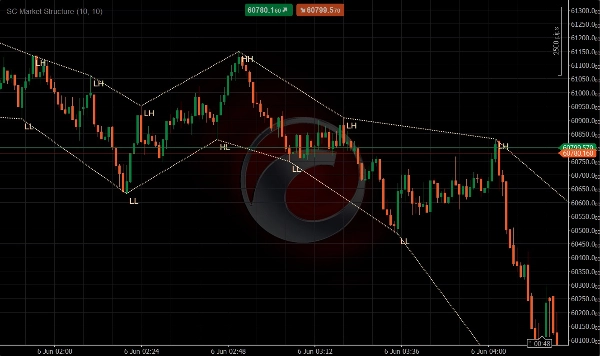
Struktura niedźwiedzia
Struktura niedźwiedzia jest identyfikowana, gdy cena tworzy:
• Lower Highs (LH)
• Lower Lows (LL)
Ta sekwencja wskazuje, że sprzedający pozostają w kontroli, a trend spadkowy nadal trwa.
Wskaźnik wizualnie łączy te punkty strukturalne za pomocą dynamicznych linii trendu, pozwalając traderom śledzić ewolucję struktury cenowej w czasie rzeczywistym.
Dlaczego warto używać SC Market Structure
Zrozumienie struktury rynku jest jednym z najważniejszych aspektów handlu opartych na analizie ruchu cen.
Wielu traderów ręcznie rysuje lokalne maksima, minima i strukturę trendu, co może być czasochłonne i subiektywne.
SC Market Structure automatyzuje ten proces, obiektywnie identyfikując punkty zwrotne struktury i oznaczając je zgodnie z profesjonalnymi zasadami analizy struktury rynku.
Dzięki temu traderzy mogą:
• Szybciej odczytywać kierunek trendu
• Wcześniej identyfikować potencjalne odwrócenia
• Potwierdzać sygnały kontynuacji trendu
• Poprawić timing wejścia i wyjścia
• Utrzymać czystszy i bardziej uporządkowany wykres
Idealne dla
• Traderów Price Action
• Skalperów
• Traderów dziennych
• Traderów swingowych
• Traderów podążających za trendem
• Traderów analizujących strukturę rynku
• Traderów korzystających z koncepcji Smart Money (SMC)
• Traderów poszukujących obiektywnej analizy struktury
Ważna uwaga
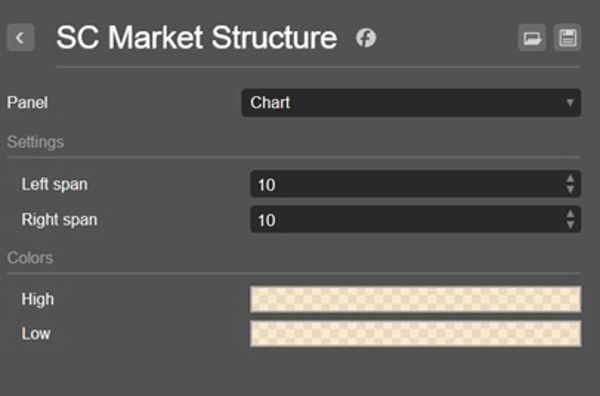
SC Market Structure identyfikuje strukturę rynku na podstawie potwierdzonych lokalnych maksimów i minimów. Etykiety i linie struktury są generowane dopiero po zatwierdzeniu punktu zwrotnego przez wybrane ustawienia kalkulacji.
Dostosowanie ustawień czułości wpłynie na częstotliwość identyfikacji i wyświetlania nowych punktów struktury.
W przeciwieństwie do tradycyjnych wskaźników MACD, jego wizualna koncepcja opiera się na integracji informacji o momentum z analizą ruchu cen. Z tego powodu używanie wskaźnika w osobnym panelu nie jest zalecane i nie zapewnia zamierzonego doświadczenia użytkownika.
Odczytuj trend. Podążaj za strukturą. Handluj z pewnością.
Podsumowanie
By continuously analyzing price action, SC Market Structure helps traders quickly determine trend direction, recognize trend continuation, and spot potential reversal points without manual chart annotations. It supports all markets and timeframes, providing a clean and intuitive chart presentation.
This tool is suited for price action traders, scalpers, day traders, swing traders, trend followers, and those using Smart Money Concepts or seeking objective market structure analysis. Sensitivity settings allow customization of pivot detection frequency. The indicator integrates momentum information into price action analysis and is designed for direct chart overlay rather than separate panels.
Opinie klientów
5 | 100 % | |
4 | 0 % | |
3 | 0 % | |
2 | 0 % | |
1 | 0 % |


