
Opis
SC RSI Dots
Minimalistyczny wskaźnik RSI wykorzystujący dynamiczne kropki dla czystszej i szybszej wizualizacji momentum.
SC RSI Dots to minimalistyczna interpretacja klasycznego RSI (Relative Strength Index), zaprojektowana tak, aby zapewnić czystszy i bardziej intuicyjny obraz momentum rynku bez zaśmiecania wykresu niepotrzebnymi liniami.
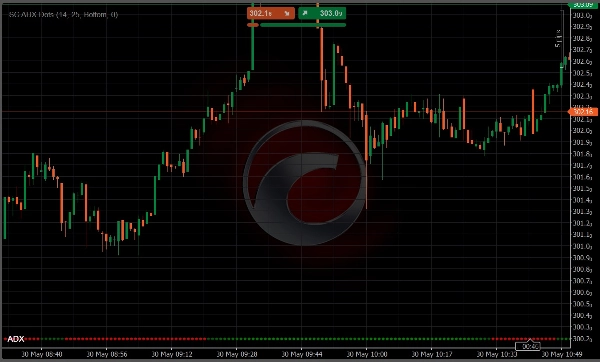
Zamiast wyświetlania tradycyjnej linii RSI, wskaźnik używa dynamicznych kropek do reprezentowania wartości RSI w czasie.
Takie podejście tworzy czystszy, bardziej nowoczesny układ wykresu, który jest łatwiejszy do odczytania, zwłaszcza dla traderów korzystających jednocześnie z wielu narzędzi.
Kluczowe cechy
- RSI wyświetlane za pomocą kropek zamiast linii
- Czystszy i mniej rozpraszający wygląd wykresu
- Dynamiczna wizualizacja koloru w zależności od pozycji RSI
- Dedykowany kolor dla warunków wyprzedania
- Dedykowany kolor dla warunków wykupienia
- Stopniowana intensywność koloru w miarę zbliżania się RSI do ekstremalnych poziomów
- Natychmiastowa wizualna identyfikacja zmian momentum
- Szybkie rozpoznanie siły i słabości rynku
- Idealny do skalpowania, handlu intraday i handlu dyskrecjonalnego
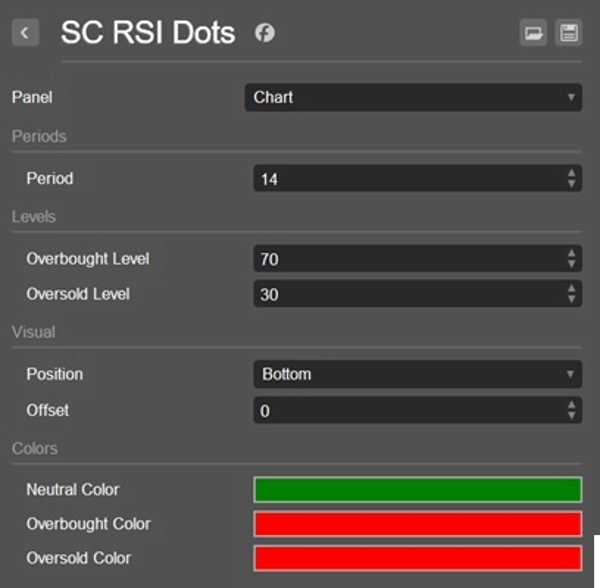
Jak działa system kolorów
SC RSI Dots wykorzystuje dynamiczny silnik kolorów, aby uprościć interpretację RSI.
- Dedykowany kolor identyfikuje warunki wyprzedania.
- Dedykowany kolor identyfikuje warunki wykupienia.
- Pomiędzy tymi dwoma strefami intensywność koloru stopniowo wzrasta, gdy RSI zbliża się do któregokolwiek z ekstremów.
Takie wizualne podejście pozwala traderom natychmiast zrozumieć, gdzie rozwija się momentum, bez konieczności ciągłego monitorowania tradycyjnej linii oscylatora.
Efektem jest szybszy i bardziej intuicyjny odczyt warunków RSI bezpośrednio z wykresu.
Dlaczego warto używać SC RSI Dots
Tradycyjne wskaźniki RSI często wymagają od traderów ciągłego monitorowania linii oscylatora i jej interakcji z poziomami wykupienia i wyprzedania.
SC RSI Dots został stworzony z jednym celem:
utrzymanie wykresu wizualnie czystym, jednocześnie dostarczając wszystkich niezbędnych informacji o momentum i warunkach rynkowych.
Adaptacyjna wizualizacja kropek ułatwia rozpoznanie:
- Rosnącego momentum byków
- Rosnącego momentum niedźwiedzi
- Zbliżania się do warunków wykupienia
- Zbliżania się do warunków wyprzedania
- Potencjalnego wyczerpania momentum
To wszystko bez rozpraszania dodatkowymi liniami na ekranie.
Idealne dla
- Traderów preferujących czyste wykresy
- Traderów momentum
- Traderów price action
- Skalperów i traderów dziennych
- Strategii handlowych z wieloma wskaźnikami
- Szybkiej analizy rynku
Ważna uwaga
SC RSI Dots jest zaprojektowany do użycia bezpośrednio na głównym wykresie cenowym.
W przeciwieństwie do tradycyjnych wskaźników RSI, jego koncepcja wizualna opiera się na integracji informacji o momentum z analizą price action. Z tego powodu używanie wskaźnika w osobnym panelu nie jest zalecane i nie zapewnia zamierzonego doświadczenia użytkownika.
Prosty. Czysty. Intuicyjny.
Podsumowanie
Key features include:
- RSI values represented by dots with dynamic colors reflecting momentum strength.
- Distinct colors for oversold and overbought conditions.
- Progressive color intensity indicating proximity to extreme RSI levels.
- Instant visual cues for momentum shifts, market strength, and weakness.
The indicator is suitable for scalping, intraday, momentum, and price action traders who prefer clean charts and use multiple tools simultaneously. It supports visualization of reversal signals, trend strength, and level touches or breaks based on RSI behavior. SC RSI Dots is intended for use on the main price chart rather than a separate panel, enhancing direct correlation between momentum and price movements.
Opinie klientów
5 | 100 % | |
4 | 0 % | |
3 | 0 % | |
2 | 0 % | |
1 | 0 % |


