
Opis
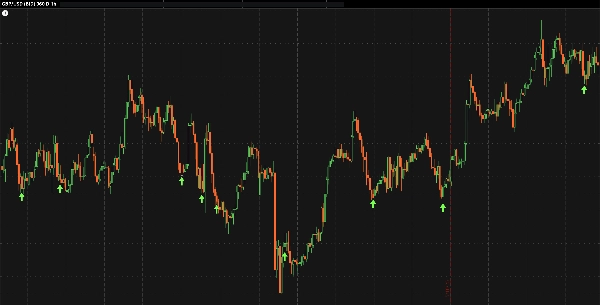
Model Odwrócenia Momentum (MRM) jest wskaźnikiem technicznym, który wizualizuje potencjalne strefy odwrócenia momentum w ruchu cen.
Analizuje wewnętrzną strukturę ruchu rynkowego, aby wyróżnić obszary, gdzie presja sprzedaży może zacząć słabnąć, a momentum odbicia może się pojawić.
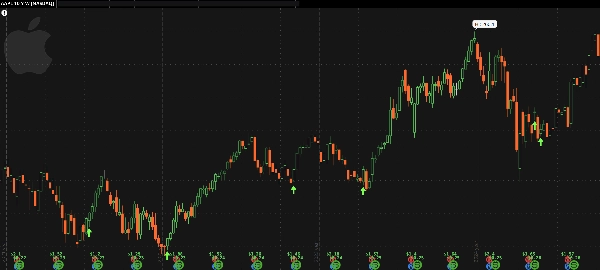
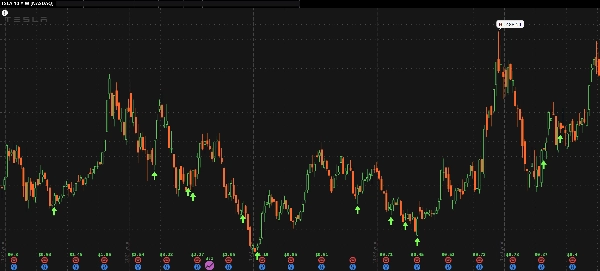
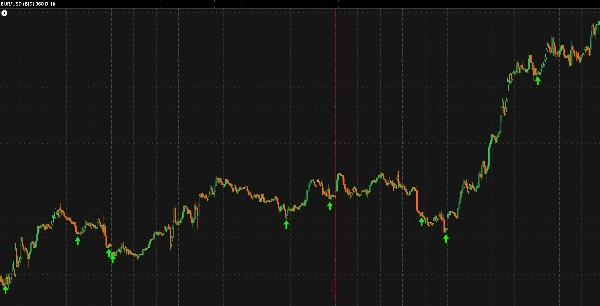
Gdy warunki wewnętrznego modelu są spełnione, MRM rysuje zieloną strzałkę pod słupkiem cenowym — oznaczając możliwy punkt odwrócenia.
Chociaż zaprojektowany głównie dla rynku forex na wykresach godzinnych, może być również stosowany do tygodniowych danych giełdowych w celu obserwacji podobnych zachowań analitycznych na różnych ramach czasowych.
Ten wskaźnik nie otwiera ani nie zarządza transakcjami. Zapewnia wizualną warstwę potwierdzenia która może uzupełniać istniejące strategie techniczne lub ustawienia dyskrecjonalne.
Kluczowe cechy:
- Wyróżnia potencjalne punkty wyczerpania i odbicia momentum
- Dostosowuje się wewnętrznie do zmiennych warunków zmienności
- Minimalna liczba parametrów dla spójnego zachowania analitycznego
💬 Twoja opinia jest ważna:
Jeśli uważasz to narzędzie za przydatne, rozważ zostawienie krótkiej recenzji w Sklepie.
Jeśli chciałbyś zobaczyć cBoty oparte na MRM opublikowane w przyszłości, śmiało wspomnij o tym w swojej opinii — zainteresowanie społeczności bezpośrednio pomaga kierować przyszłymi wydaniami.
Zastrzeżenie:
Model Odwrócenia Momentum jest udostępniany bezpłatnie wyłącznie do celów analitycznych i edukacyjnych.
Nie stanowi porady finansowej, wskazówek handlowych ani rekomendacji kupna lub sprzedaży jakiegokolwiek instrumentu.
Nie udziela żadnej gwarancji co do dokładności, wydajności ani rezultatów.
Wszystkie decyzje handlowe podejmowane są wyłącznie na własne ryzyko użytkownika, a za jakiekolwiek straty lub szkody wynikające z jego użycia nie ponosi się odpowiedzialności.


![Logo „[Hamster-Coder] Pivot Points MTF”](https://cdn.ctrader.com/image/webp/4c143e5a-309c-40e3-a578-f04d1e133ffa_31159)


