
Deskripsi
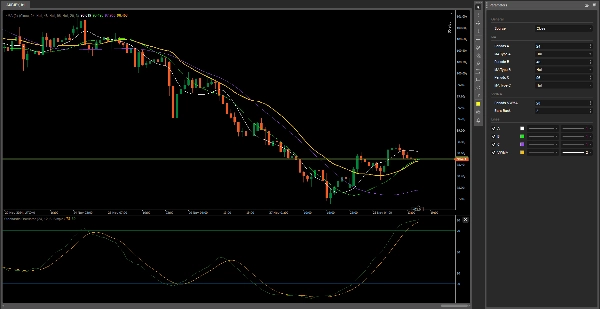
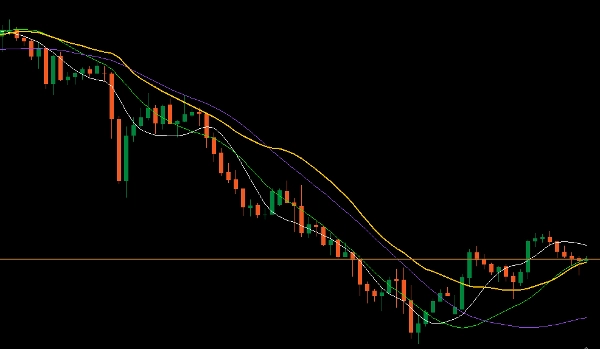
Indikator ini terdiri dari 3 rata-rata bergerak yang dapat dikonfigurasi sesuai keinginan Anda, mulai dari jenis rata-rata bergerak hingga warnanya, ketebalan, dan jenis garisnya.
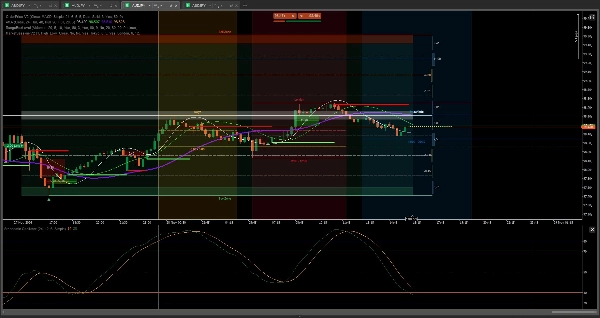
Yang keempat adalah VWMA (Volume-Weighted Moving Average) – rumus tipikal untuk indikator ini adalah - VWMA 3 hari = (C1 * V1 + C2 * V2 + C3 * V3) / (V1 + V2 + V3).
Dalam opsi ini, saya telah membuat kemungkinan untuk mengulangi interval tidak hanya 3 kali tetapi hingga 500 kali.
Saya membuat ini untuk menjaga grafik tetap bersih.
Parameter default adalah rata-rata bergerak hull yang sempurna dan periode 24, 48, 96 lebih optimal bagi saya di setiap kerangka waktu.
Tambahan
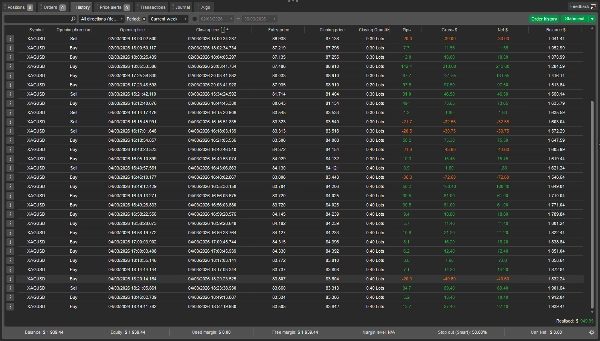
Ini adalah alat yang membantu saya menghasilkan uang
https://ctrader.com/products/3441?u=Thomas-Sparrow
https://ctrader.com/products/526?u=Thomas-Sparrow
https://ctrader.com/products/3137?u=Thomas-Sparrow
https://ctrader.com/products/2913?u=Thomas-Sparrow
Anda akan menjadi tak terkalahkan
Semoga berhasil 😀
Ringkasan
Ulasan pelanggan
5 | 100 % | |
4 | 0 % | |
3 | 0 % | |
2 | 0 % | |
1 | 0 % |


