Penerangan
Struktur Pasaran SC
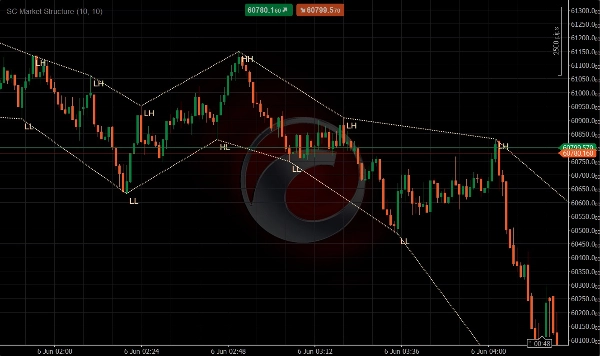
Struktur Pasaran SC adalah penunjuk struktur pasaran visual yang direka untuk mengenal pasti dan memaparkan ayunan tinggi dan rendah yang paling penting secara automatik terus pada carta.
Penunjuk ini sentiasa menganalisis tindakan harga dan memetakan evolusi struktur pasaran dengan menghubungkan tinggi dan rendah yang signifikan dengan garis struktur dinamik. Ini membolehkan pedagang segera mengenal pasti arah aliran, kesinambungan aliran, dan titik pembalikan yang berpotensi tanpa menandakan ayunan pasaran secara manual.
Selain itu, Struktur Pasaran SC secara automatik mengklasifikasikan setiap titik struktur baru menggunakan definisi struktur pasaran standard:
- HH (Tinggi Lebih Tinggi)
- HL (Rendah Lebih Tinggi)
- LH (Tinggi Lebih Rendah)
- LL (Rendah Lebih Rendah)
Dengan menggabungkan pengesanan ayunan automatik dengan pelabelan struktur pasaran masa nyata, pedagang dapat dengan cepat memahami sama ada pasaran sedang trending, mengukuh, atau menunjukkan tanda-tanda pembalikan aliran yang berpotensi.
Ciri-ciri Utama
• Pengesanan automatik ayunan tinggi dan rendah yang signifikan
• Garis struktur dinamik yang menghubungkan titik pusing pasaran
• Pengenalpastian automatik Tinggi Lebih Tinggi (HH)
• Pengenalpastian automatik Rendah Lebih Tinggi (HL)
• Pengenalpastian automatik Tinggi Lebih Rendah (LH)
• Pengenalpastian automatik Rendah Lebih Rendah (LL)
• Visualisasi jelas struktur pasaran bullish dan bearish
• Pengenalan segera corak kesinambungan dan pembalikan aliran
• Berfungsi pada semua pasaran dan jangka masa
• Persembahan carta yang bersih dan intuitif
Visualisasi Struktur Pasaran
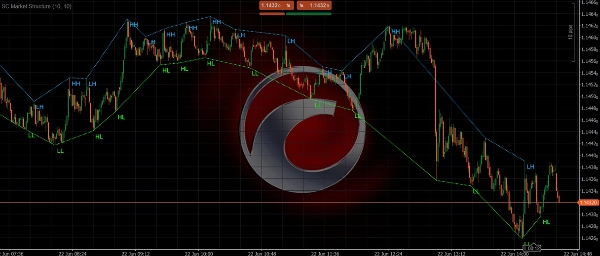
Struktur Pasaran SC sentiasa menilai ayunan harga dan melabel setiap titik struktur yang baru disahkan.
Struktur Bullish
Struktur pasaran bullish dikenalpasti apabila harga membentuk:
• Tinggi Lebih Tinggi (HH)
• Rendah Lebih Tinggi (HL)
Susunan ini menunjukkan pembeli masih mengawal dan aliran menaik masih utuh.
Struktur Bearish
Struktur pasaran bearish dikenalpasti apabila harga membentuk:
• Tinggi Lebih Rendah (LH)
• Rendah Lebih Rendah (LL)
Susunan ini menunjukkan penjual masih mengawal dan aliran menurun masih utuh.
Penunjuk ini menghubungkan titik struktur ini secara visual menggunakan garis aliran dinamik, membolehkan pedagang mengikuti evolusi struktur harga secara masa nyata.
Mengapa Menggunakan Struktur Pasaran SC
Memahami struktur pasaran adalah salah satu aspek paling penting dalam perdagangan tindakan harga.
Ramai pedagang melukis ayunan tinggi, ayunan rendah, dan struktur aliran secara manual, yang boleh memakan masa dan subjektif.
Struktur Pasaran SC mengautomasikan proses ini dengan mengenal pasti titik pusing struktur secara objektif dan melabelnya mengikut prinsip struktur pasaran profesional.
Ini membolehkan pedagang untuk:
• Membaca arah aliran dengan lebih cepat
• Mengenal pasti pembalikan yang berpotensi lebih awal
• Mengesahkan persediaan kesinambungan aliran
• Memperbaiki masa masuk dan keluar
• Mengekalkan carta yang lebih bersih dan teratur
Sesuai Untuk
• Pedagang Tindakan Harga
• Scalper
• Pedagang Harian
• Pedagang Ayunan
• Pedagang Mengikuti Aliran
• Pedagang Struktur Pasaran
• Pedagang Konsep Wang Pintar (SMC)
• Pedagang yang mencari analisis struktur objektif
Nota Penting
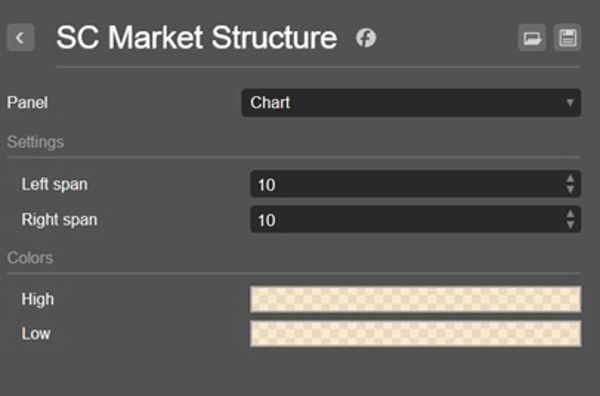
Struktur Pasaran SC mengenal pasti struktur pasaran berdasarkan ayunan tinggi dan rendah yang disahkan. Label dan garis struktur hanya dijana selepas titik pusing disahkan oleh tetapan pengiraan yang dipilih.
Melaraskan tetapan sensitiviti akan mempengaruhi kekerapan titik struktur baru dikenalpasti dan dipaparkan.
Tidak seperti penunjuk MACD tradisional, konsep visualnya dibina di sekitar mengintegrasikan maklumat momentum ke dalam analisis tindakan harga. Oleh itu, menggunakan penunjuk ini dalam panel berasingan tidak disyorkan dan tidak memberikan pengalaman pengguna yang dimaksudkan.
Baca aliran. Ikuti struktur. Berdagang dengan yakin.
Ringkasan
By continuously analyzing price action, SC Market Structure helps traders quickly determine trend direction, recognize trend continuation, and spot potential reversal points without manual chart annotations. It supports all markets and timeframes, providing a clean and intuitive chart presentation.
This tool is suited for price action traders, scalpers, day traders, swing traders, trend followers, and those using Smart Money Concepts or seeking objective market structure analysis. Sensitivity settings allow customization of pivot detection frequency. The indicator integrates momentum information into price action analysis and is designed for direct chart overlay rather than separate panels.
Ulasan pelanggan
5 | 100 % | |
4 | 0 % | |
3 | 0 % | |
2 | 0 % | |
1 | 0 % |