Penerangan
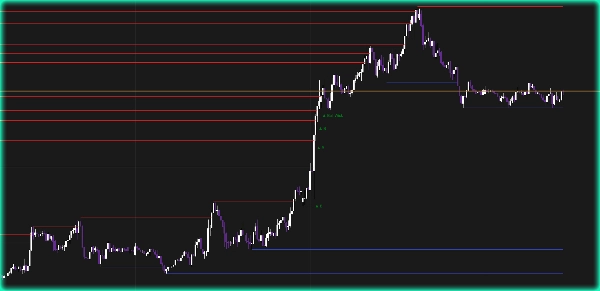
Tahap Sokongan & Rintangan dengan Pecahan oleh [BeyondTrading] — Lihat setiap tahap langsung dan setiap pecahan sebenar. Mengesan secara automatik puncak dan dasar pivot serta melukis garis sokongan dan rintangan mendatar terus pada carta. Setiap garis memanjang bar demi bar secara masa nyata selagi tahap itu bertahan. Pada saat harga ditutup melaluinya, garis berhenti — tepat pada titik sentuhan. Tiada lukisan manual, tiada tahap lapuk yang mengacaukan carta anda.
Apabila satu tahap dipecahkan, isyarat muncul serta-merta: B untuk pecahan bersih dengan volum, Bull Wick atau Bear Wick apabila penutupan didorong oleh wick dan bukan penutupan badan sebenar. Penapis volum menghapuskan pergerakan kurang meyakinkan dan hanya mengekalkan isyarat yang penting.
Mengapa tahap S/R penting Tahap sokongan dan rintangan bukan sekadar garis — ia adalah kolam kecairan. Setiap kali harga menolak satu tahap, pesanan hentian dan pesanan tertunda terkumpul tepat di atas dan di bawahnya. Apabila harga kembali, institusi datang sama ada untuk mempertahankan tahap itu atau memburu hentian yang berada di situ sebelum pergerakan sebenar bermula. Tahap rintangan yang telah diuji tiga kali dan tidak pernah dipecahkan bukanlah rawak — ia adalah tempat pesanan jual bertimbun dan tempat pedagang pecahan akan terperangkap jika pergerakan itu palsu. Mengetahui tahap mana yang masih aktif dan mana yang sudah diambil memberitahu anda dengan tepat di mana reaksi seterusnya mungkin berlaku.
Ciri-ciri
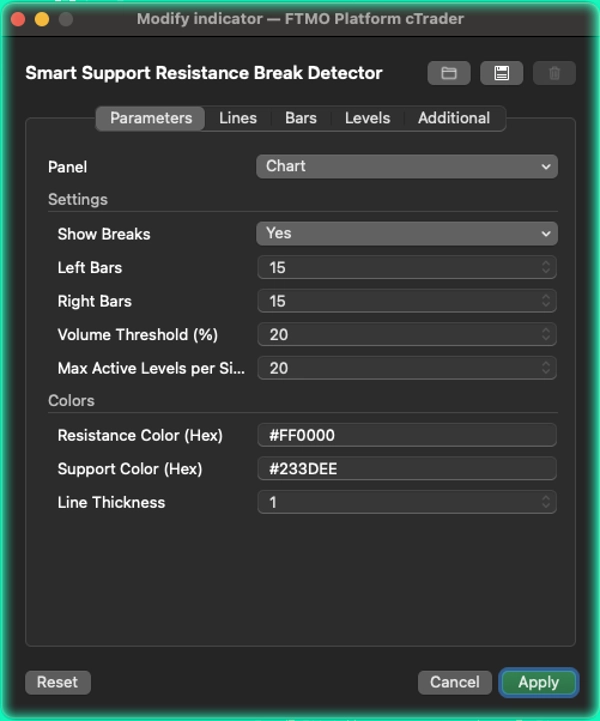
- Pengesanan pivot dengan Bar Kiri dan Bar Kanan yang boleh dikonfigurasikan untuk sebarang gaya perdagangan
- Garis memanjang secara dinamik pada setiap bar — ia berhenti sebaik harga ditutup melaluinya
- Penapis volum (osilator EMA 5/10) untuk membezakan pecahan sebenar daripada bunyi
- Label pecahan: B untuk pecahan volum bersih, Bull Wick dan Bear Wick untuk pergerakan yang didorong oleh wick
- Penapisan pendua — tahap yang terlalu dekat dengan yang sedia ada diabaikan secara automatik
- Maksimum Tahap Aktif setiap sisi untuk memastikan carta bersih dan mudah dibaca
- Warna rintangan dan sokongan yang boleh dikonfigurasikan sepenuhnya dengan input hex
Ringkasan
The indicator features volume-confirmed break signals to distinguish genuine breakouts from low-conviction moves. It displays specific labels: "B" for clean volume breaks, and "Bull Wick" or "Bear Wick" when breaks are driven by wicks rather than body closes. A volume filter based on EMA oscillators helps filter out noise.
Additional functionalities include configurable pivot detection parameters (Left Bars and Right Bars), automatic filtering of duplicate levels, and limits on the maximum number of active levels per side to maintain chart clarity. Users can customize support and resistance line colors using hex codes.
This tool is designed to highlight key liquidity pools where institutional orders accumulate, aiding traders in identifying active levels and potential reaction points in the market.