
Penerangan
Sokongan & Rintangan SC
Alat Sokongan & Rintangan Profesional yang Setiap Pedagang Perlu Miliki
Sokongan & Rintangan SC adalah penunjuk tindakan harga canggih yang direka untuk mengenal pasti, mengurus, dan memvisualisasikan secara automatik zon sokongan dan rintangan dinamik terus pada carta.
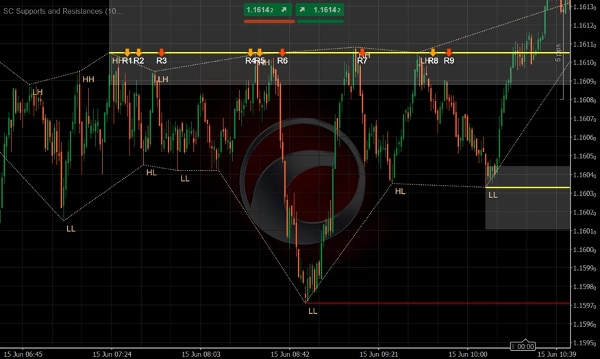
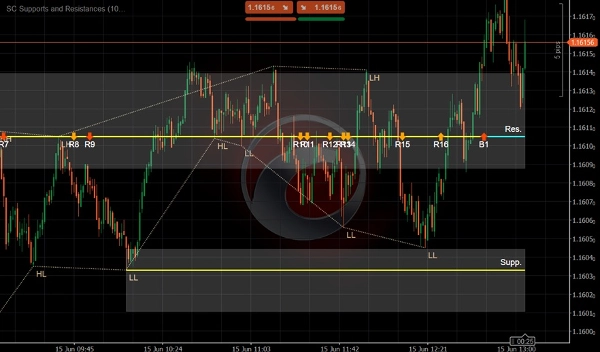
Tidak seperti alat sokongan dan rintangan tradisional yang bergantung pada garis mendatar mudah, Sokongan & Rintangan SC menggunakan jalur berasaskan ATR yang adaptif untuk mewakili kawasan reaksi pasaran yang realistik, membantu pedagang memahami di mana harga paling mungkin ditolak, mengukuh, atau menembusi.
Penunjuk ini sentiasa menganalisis ayunan pasaran untuk mengesan tahap sokongan dan rintangan yang signifikan, mengesan bagaimana harga berinteraksi dengan setiap zon dari masa ke masa, dan secara automatik mengklasifikasikan setiap reaksi sebagai Penolakan atau Penembusan. Reaksi kuat diserlahkan secara berasingan, membolehkan pedagang segera membezakan antara ujian kecil dan peristiwa pasaran yang bermakna.
Dengan menggabungkan pengesanan tahap pintar, pengurusan zon dinamik, dan analisis reaksi masa nyata, Sokongan & Rintangan SC mengubah perdagangan sokongan dan rintangan menjadi proses yang objektif dan boleh diukur.
Ciri Utama
✔ Pengesanan automatik zon sokongan dan rintangan yang signifikan
✔ Jalur berasaskan ATR dinamik yang menyesuaikan dengan volatiliti pasaran
✔ Pengenalan automatik Penolakan dan Penembusan
✔ Pengesanan Penolakan Kuat dan Penembusan Kuat
✔ Penjejakan masa nyata kekuatan tahap dan reaksi pasaran
✔ Pengenalan tahap ayunan pintar berdasarkan tingkah laku harga
✔ Luput automatik tahap usang untuk memastikan carta bersih
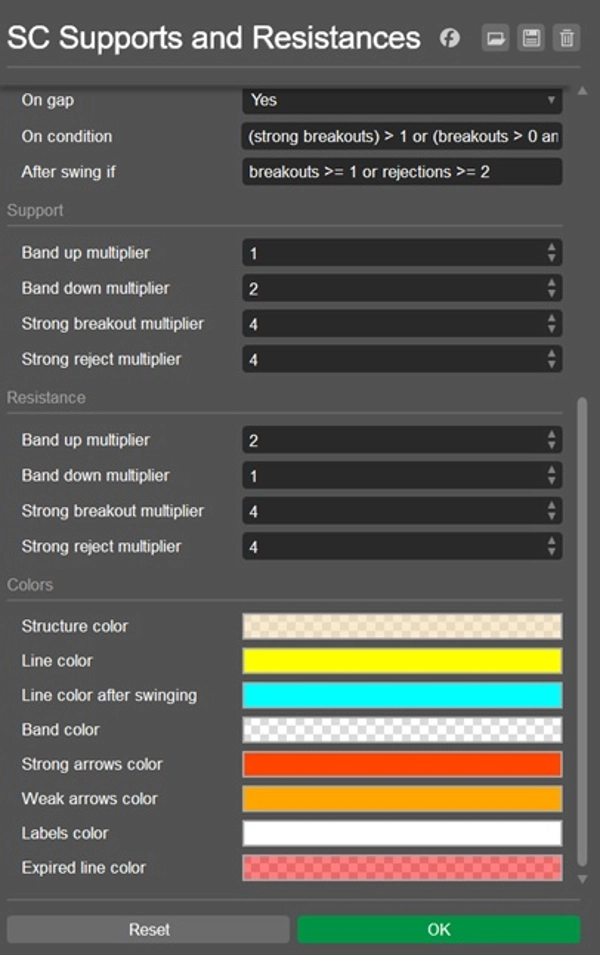
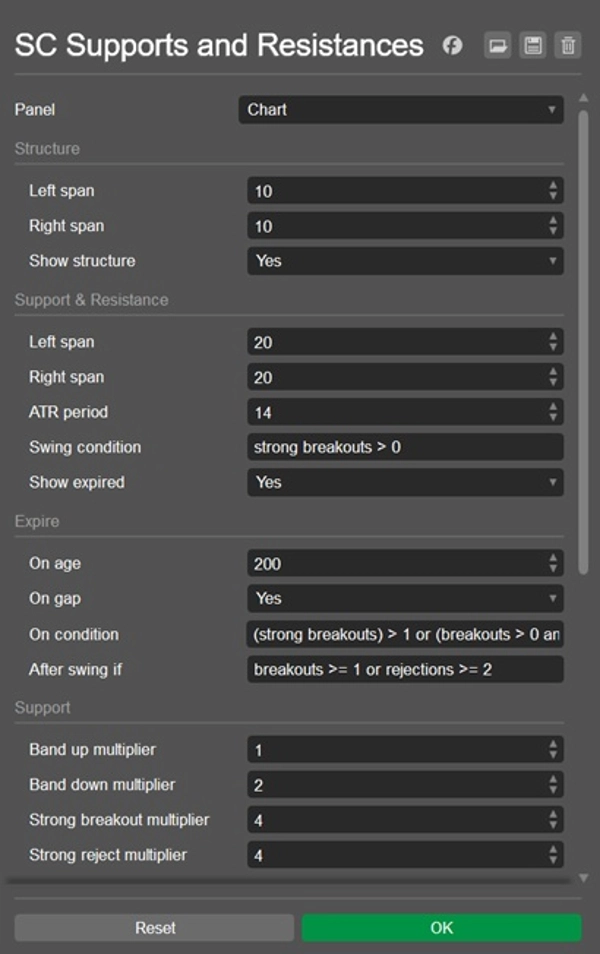
✔ Kepekaan dan kriteria reaksi yang boleh disesuaikan sepenuhnya
✔ Representasi visual yang jelas dengan jalur, anak panah, label, dan statistik
✔ Berfungsi pada semua pasaran dan semua jangka masa
Kecerdasan Tahap Lanjutan
Sokongan & Rintangan SC melakukan lebih daripada sekadar melukis tahap.
Setiap zon yang dikesan berkembang mengikut bagaimana pasaran berinteraksi dengannya. Penunjuk ini sentiasa memantau:
- Penolakan
- Penembusan
- Penolakan Kuat
- Penembusan Kuat
- Umur Tahap
- Pembentukan Ayunan
Apabila keadaan pasaran berubah, tahap boleh secara automatik menjadi penting, menjadi tahap ayunan signifikan, atau luput apabila tidak lagi relevan.
Ini mewujudkan rangka kerja sokongan dan rintangan yang hidup yang mencerminkan tingkah laku pasaran sebenar dan bukannya garis sejarah statik.
Jalur Dinamik Gantikan Garis Tunggal
Pasaran jarang bertindak balas pada harga yang tepat.
Oleh itu, Sokongan & Rintangan SC mewakili setiap tahap sebagai zon harga dinamik, saiznya secara automatik menyesuaikan dengan volatiliti melalui pengiraan ATR.
Ini memberikan representasi yang lebih realistik tentang kawasan bekalan dan permintaan sambil mengurangkan isyarat palsu yang dihasilkan oleh penembusan harga yang tidak signifikan.
Hasilnya adalah pandangan yang lebih bersih dan tepat tentang di mana peserta pasaran benar-benar mempertahankan harga.
Isyarat Perdagangan Berdasarkan Reaksi
Setiap interaksi dengan zon sokongan atau rintangan dinilai secara masa nyata.
Apabila harga menolak zon, penunjuk menghasilkan isyarat arah yang jelas. Apabila harga berjaya menembusi tahap, isyarat penembusan dihasilkan dan diklasifikasikan mengikut kekuatannya.
Ini membolehkan pedagang mengenal pasti dengan segera:
- Peluang pembalikan berpotensi
- Persediaan kesinambungan trend
- Pengesahan penembusan
- Percubaan penembusan gagal
- Zon reaksi institusi yang menarik minat tinggi
Pengurusan Kitaran Hayat Tahap Automatik
Salah satu cabaran terbesar dalam perdagangan sokongan dan rintangan adalah menentukan bila sesuatu tahap tidak lagi relevan.
Sokongan & Rintangan SC menguruskan seluruh kitaran hayat setiap tahap secara automatik melalui logik luput pintar berdasarkan:
- Ketiadaan aktiviti pasaran
- Jurang harga
- Tingkah laku penembusan
- Tingkah laku penolakan
- Logik pengesahan ayunan
Hasilnya adalah carta yang kekal fokus hanya pada tahap yang masih penting, menghapuskan kekacauan yang tidak perlu dan maklumat yang lapuk.
Mengapa Menggunakan Sokongan & Rintangan SC
Sokongan dan rintangan kekal antara konsep paling penting dalam analisis teknikal, namun ramai pedagang masih melukis tahap secara manual, menyebabkan tafsiran subjektif dan keputusan yang tidak konsisten.
Sokongan & Rintangan SC menghapuskan ketidakpastian ini dengan menyediakan pendekatan objektif berasaskan peraturan untuk mengenal pasti dan mengurus tahap pasaran utama.
Ini membolehkan pedagang:
✔ Mengenal pasti zon reaksi berkemungkinan tinggi dengan lebih cepat
✔ Mengukur kekuatan tahap sokongan dan rintangan
✔ Mengesan penembusan dan penolakan yang bermakna dengan segera
✔ Memperbaiki masa masuk dan keluar
✔ Mengurangkan kekacauan carta
✔ Berdagang dengan keyakinan dan konsistensi yang lebih tinggi
Sesuai Untuk
- Pedagang Tindakan Harga
- Scalper
- Pedagang Harian
- Pedagang Ayunan
- Pedagang Trend
- Pedagang Konsep Wang Pintar (SMC)
- Pedagang Sokongan & Rintangan
- Penganalisis Teknikal Profesional
Nota Penting
Sokongan & Rintangan SC mengenal pasti tahap menggunakan pivot pasaran yang disahkan dan pengiraan volatiliti adaptif.
Kualiti dan kekerapan tahap yang dijana bergantung pada tetapan kepekaan dan parameter reaksi yang dipilih.
Melaraskan tetapan ini membolehkan pedagang menyesuaikan penunjuk untuk pelbagai pasaran, gaya perdagangan, dan jangka masa.
Kenal Pasti Tahap. Ukur Reaksi.
Berdagang Apa yang Penting.
Ringkasan
Key functionalities include automatic detection and expiration of levels, intelligent swing-level recognition, and customizable sensitivity settings. Visual outputs feature dynamic bands, arrows, labels, and statistics to clearly represent zones and market reactions. This tool supports all markets and timeframes, providing objective, rules-based identification of key price levels to assist traders in recognizing potential reversals, trend continuations, breakout confirmations, and institutional reaction zones.
SC Supports & Resistances is suitable for various trading styles, including price action, scalping, day trading, swing trading, trend trading, and Smart Money Concept approaches. It aims to reduce chart clutter and improve entry and exit timing by maintaining a living framework of relevant support and resistance levels that evolve with market behavior.


