present
ลงทะเบียนและรับส่วนลด $50 สำหรับการซื้อครั้งแรกของคุณ
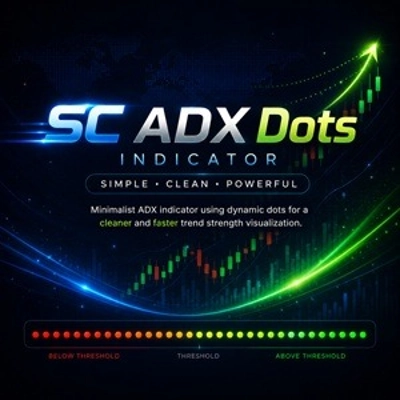
Trading product for SC RSI Dots อินดิเคเตอร์ RSI, image 1
SC RSI Dots
อินดิเคเตอร์
52 ดาวน์โหลด
เวอร์ชัน 1.3, Jun 2026
Windows, Mac
5.0
รีวิว: 1
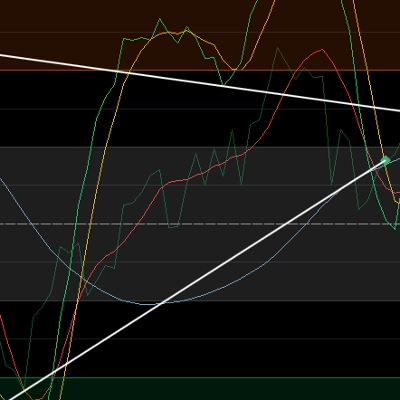
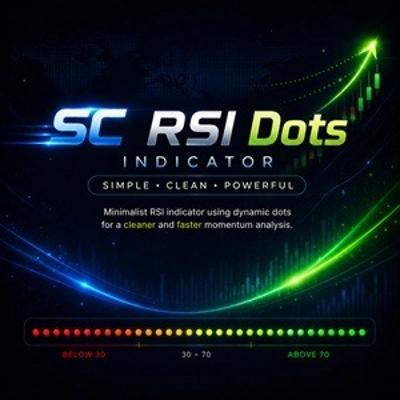
Trading product for SC RSI Dots อินดิเคเตอร์ RSI, image 2
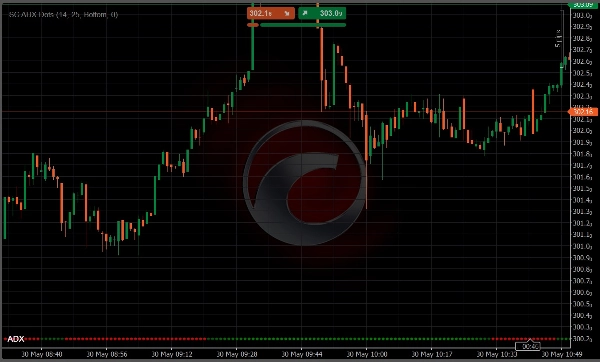
Trading product for SC RSI Dots อินดิเคเตอร์ RSI, image 3
ตั้งแต่ 04/01/2026
401
ติดตั้งฟรี

คำอธิบาย

SC RSI Dots

ตัวบ่งชี้ RSI แบบมินิมอลที่ใช้จุดแบบไดนามิกเพื่อการแสดงผลโมเมนตัมที่สะอาดและรวดเร็วขึ้น

SC RSI Dots คือการตีความแบบมินิมอลของ RSI (ดัชนีความแข็งแกร่งสัมพัทธ์) แบบคลาสสิก ซึ่งออกแบบมาเพื่อให้มุมมองโมเมนตัมตลาดที่สะอาดและเข้าใจง่ายขึ้นโดยไม่ทำให้กราฟรกด้วยเส้นที่ไม่จำเป็น

แทนที่จะโชว์เส้น RSI แบบดั้งเดิม ตัวบ่งชี้นี้ใช้จุดแบบไดนามิกเพื่อแทนค่าของ RSI ตามเวลา

วิธีนี้สร้างเลย์เอาต์กราฟที่สะอาดและทันสมัยมากขึ้นซึ่งอ่านง่ายกว่า โดยเฉพาะสำหรับเทรดเดอร์ที่ใช้เครื่องมือหลายอย่างพร้อมกัน

คุณสมบัติหลัก

  • แสดง RSI โดยใช้จุดแทนเส้น
  • รูปลักษณ์กราฟที่สะอาดและไม่รบกวนสายตา
  • การแสดงสีแบบไดนามิกตามตำแหน่งของ RSI
  • สีเฉพาะสำหรับสภาวะขายมากเกินไป
  • สีเฉพาะสำหรับสภาวะซื้อมากเกินไป
  • ความเข้มของสีเพิ่มขึ้นอย่างต่อเนื่องเมื่อ RSI เข้าใกล้ระดับสุดขีด
  • การระบุการเปลี่ยนแปลงโมเมนตัมได้ทันที
  • การรับรู้ความแข็งแกร่งและความอ่อนแอของตลาดอย่างรวดเร็ว
  • เหมาะสำหรับการสแคปปิ้ง การเทรดภายในวัน และการเทรดแบบมีดุลยพินิจ


ระบบสีทำงานอย่างไร

SC RSI Dots ใช้เครื่องยนต์สีแบบไดนามิกเพื่อทำให้การตีความ RSI ง่ายขึ้น

  • สีเฉพาะระบุสภาวะ ขายมากเกินไป
  • สีเฉพาะระบุสภาวะ ซื้อมากเกินไป
  • ระหว่างสองโซนนี้ ความเข้มของสีจะเพิ่มขึ้นอย่างค่อยเป็นค่อยไปเมื่อ RSI เข้าใกล้ระดับสุดขีดใดระดับหนึ่ง

วิธีการแสดงผลนี้ช่วยให้เทรดเดอร์เข้าใจได้ทันทีว่าโมเมนตัมกำลังพัฒนาอยู่ที่ใดโดยไม่ต้องเฝ้าดูเส้นออสซิลเลเตอร์แบบดั้งเดิมอย่างต่อเนื่อง

ผลลัพธ์คือการอ่านสภาวะ RSI ได้รวดเร็วและเข้าใจง่ายขึ้นโดยตรงจากกราฟ


ทำไมต้องใช้ SC RSI Dots

ตัวบ่งชี้ RSI แบบดั้งเดิมมักต้องการให้เทรดเดอร์เฝ้าดูเส้นออสซิลเลเตอร์และการปฏิสัมพันธ์กับระดับซื้อมากเกินไปและขายมากเกินไปอย่างต่อเนื่อง

SC RSI Dots ถูกสร้างขึ้นด้วยเป้าหมายเดียว:

เพื่อให้กราฟดูสะอาดตาในขณะที่ยังคงให้ข้อมูลสำคัญทั้งหมดเกี่ยวกับโมเมนตัมและสภาวะตลาด

การแสดงผลจุดแบบปรับได้ทำให้ง่ายต่อการรับรู้:

  • โมเมนตัมขาขึ้นที่เพิ่มขึ้น
  • โมเมนตัมขาลงที่เพิ่มขึ้น
  • การเข้าใกล้สภาวะซื้อมากเกินไป
  • การเข้าใกล้สภาวะขายมากเกินไป
  • ความเป็นไปได้ของการหมดแรงโมเมนตัม

ทั้งหมดนี้โดยไม่มีสิ่งรบกวนสายตาจากเส้นเพิ่มเติมบนหน้าจอ


เหมาะสำหรับ

  • เทรดเดอร์ที่ชอบกราฟที่สะอาด
  • เทรดเดอร์โมเมนตัม
  • เทรดเดอร์ที่ใช้การเคลื่อนไหวของราคา
  • สแคปเปอร์และเทรดเดอร์รายวัน
  • การตั้งค่าการเทรดหลายตัวบ่งชี้
  • การวิเคราะห์ตลาดอย่างรวดเร็ว


หมายเหตุสำคัญ

SC RSI Dots ถูกออกแบบมาให้ใช้โดยตรงบนกราฟราคาหลัก

แตกต่างจากตัวบ่งชี้ RSI แบบดั้งเดิม แนวคิดการแสดงผลของมันถูกสร้างขึ้นโดยการผสานข้อมูลโมเมนตัมเข้ากับการวิเคราะห์การเคลื่อนไหวของราคา ด้วยเหตุนี้ การใช้ตัวบ่งชี้ในแผงแยกจึงไม่แนะนำและไม่ให้ประสบการณ์การใช้งานตามที่ตั้งใจไว้


เรียบง่าย สะอาด เข้าใจง่าย

สรุป

สรุปโดย AI
SC RSI Dots is a minimalist Relative Strength Index (RSI) indicator designed to display momentum on the main price chart using dynamic colored dots instead of the traditional RSI line. This approach provides a cleaner, less cluttered visual that integrates momentum information directly with price action, facilitating faster and more intuitive market analysis.

Key features include:
- RSI values represented by dots with dynamic colors reflecting momentum strength.
- Distinct colors for oversold and overbought conditions.
- Progressive color intensity indicating proximity to extreme RSI levels.
- Instant visual cues for momentum shifts, market strength, and weakness.

The indicator is suitable for scalping, intraday, momentum, and price action traders who prefer clean charts and use multiple tools simultaneously. It supports visualization of reversal signals, trend strength, and level touches or breaks based on RSI behavior. SC RSI Dots is intended for use on the main price chart rather than a separate panel, enhancing direct correlation between momentum and price movements.
โปรไฟล์อินดิเคเตอร์
หมวดหมู่อินดิเคเตอร์
Momentum
ประเภทเอาต์พุต
การแสดงเป็นภาพ
สัญญาณ
ข้อกำหนดด้านข้อมูล
แท่งเท่านั้น
สัญญาณที่รองรับ
Reversal
ความแข็งแกร่งของแนวโน้ม
แตะ Level ที่ระบุ
เบรก Level ที่ระบุ

รีวิวจากลูกค้า

5.0
รีวิว: 1
5
100 %
4
0 %
3
0 %
2
0 %
1
0 %
รีวิวจากลูกค้า
July 19, 2026
SC RSI Dots is a brilliant minimalist take on the classic RSI oscillator. By replacing cluttered lines with dynamic dots plotted directly on the price chart, it seamlessly integrates momentum data into your price action analysis. The progressive color intensity as RSI approaches overbought/oversold zones provides instant visual feedback. While it lacks alerts and can linger in extremes during strong trends, it’s a lightweight, highly effective tool for scalpers who value clean charts.

การสนทนา

คำถามที่พบบ่อย

RSI
ผลิตภัณฑ์ที่มีให้บริการผ่าน cTrader Store รวมถึงบอทการเทรด อินดิเคเตอร์ และปลั๊กอิน มีให้บริการโดยนักพัฒนาบุคคลที่สามและมีไว้เพื่อวัตถุประสงค์ในการเข้าถึงข้อมูลและทางเทคนิคเท่านั้น cTrader Store ไม่ใช่โบรกเกอร์และไม่ได้ให้คำแนะนำการลงทุน คำแนะนำส่วนบุคคล หรือการรับประกันผลการดำเนินงานในอนาคต

เพิ่มเติมจากผู้เขียนคนนี้

อินดิเคเตอร์
Market Structure
Automatic market structure detection with HH, HL, LH and LL labels directly on the chart.
อินดิเคเตอร์
ATR
Key Levels
+2
Professional support & resistance detection with adaptive bands and smart signals.
อินดิเคเตอร์
ATR
ATR-based trailing stop that adapts to volatility, protects profits, and follows trends automatically.
cBot
Key Levels
SL Manager
+5
Adaptive cTrader bot based on Support & Resistance with advanced risk management and smart filtering.
2.87
อัตราส่วน กำไรต่อขาดทุน
อินดิเคเตอร์
MACD
Dynamic MACD histogram dots with smart crossing signals for faster momentum analysis.
อินดิเคเตอร์
ADX
Minimalist ADX indicator using dynamic dots for a cleaner and faster trend strength visualization.

นอกจากนี้คุณยังอาจชอบ

"Sessions" โลโก้
ยอดนิยม
5.0
(4)
$19
/
$29
อินดิเคเตอร์
Prop
Forex
+5
Tracks NY, London, Tokyo, Sydney sessions with custom visuals, and a real-time expanding range box and breakout High/Low
อินดิเคเตอร์
ATR
RSI
+6
📊Zones Supply & Demand: Identifies key price levels with high volume concentration, marking Supply/Demand Zones & Marke
อินดิเคเตอร์
AI
Grid
+17
Clean 3D, Sleek Candles for Trend Patterns.
"QX Heatmap Scanner" โลโก้
ยอดนิยม
4.3
(3)
$19
/
$38
อินดิเคเตอร์
ATR
RSI
+19
Multi-timeframe heatmap scoring Direction, Strength & Volatility at a glance!
"Market Sentiment Pro" โลโก้
ยอดนิยม
3.6
(3)
$19
อินดิเคเตอร์
Forex
BTCUSD
+9
Market Sentiment Pro: Predict tops & bottoms using crowd psychology. Contrarian signals with 70-80% accuracy. Early Acce
อินดิเคเตอร์
BOS
MSS
+5
Your entire ICT session map, structure engine, and key levels — No manual work. One indicator. Every session!
อินดิเคเตอร์
Customize your Moving Average! Choose any timeframe and price source for precision and flexibility in your analysis.
"SwingHighLow" โลโก้
ยอดนิยม
4.3
(3)
$35
/
$50
อินดิเคเตอร์
ATR
Forex
+9
Auto-detect swing highs/lows. Spot reversals, map structure, and filter noise with adjustable strength.
อินดิเคเตอร์
This is an indicator that displays candlesticks from different timeframes. This is the demo version with a 30-day expira
อินดิเคเตอร์
ATR
Volume
+5
Order blocks with measured hold-rate stats and confidence scoring — not just zones on a chart.
"Half Trend BT" โลโก้
ยอดนิยม
4.3
(3)
$50
/
$100
อินดิเคเตอร์
Prop
Forex
+5
Half Trend – Trend Reversal Indicator for cTrader
"MGC Trend Analysis 1.4" โลโก้
ยอดนิยม
4.6
(5)
$20
/
$40
อินดิเคเตอร์
Forex
BTCUSD
+5
Trend analysis, automatic analysis, position, swingtrader, scalper
"Vwap Bands" โลโก้
เรตติ้งสูง
4.5
(4)
$19
/
$29
อินดิเคเตอร์
VWAP
Moving Average
Vwap Bands it is highly sought after by professional traders because it includes Standard Deviation Bands
อินดิเคเตอร์
EMA
Volume
+2
Walk-forward tested London-open signal, rated CONFIRMED/WEAK/NEGATIVE with real historical win rate
อินดิเคเตอร์
ATR
EMA
+4
SCALPING M1 CTRADER v1.0 — Institutional-Grade M1 Gold & Forex Scalping System
อินดิเคเตอร์
AI
ATR
+27
WICK COMMANDER — Know Exactly When the Market Commits
อินดิเคเตอร์
BOS
CHOCH
+5
A professional-grade cTrader indicator for traders following the Inner Circle Trader (ICT) methodology.
อินดิเคเตอร์
Demo of my main indcator.

ราคา

ตั้งแต่ 04/01/2026
401
ติดตั้งฟรี