
คำอธิบาย
โครงสร้างตลาด SC
โครงสร้างตลาด SC เป็นตัวบ่งชี้โครงสร้างตลาดแบบภาพที่ออกแบบมาเพื่อระบุและแสดงจุดสูงสุดและต่ำสุดของสวิงที่สำคัญที่สุดโดยอัตโนมัติบนแผนภูมิ
ตัวบ่งชี้จะวิเคราะห์การเคลื่อนไหวของราคาอย่างต่อเนื่องและทำแผนที่วิวัฒนาการของโครงสร้างตลาดโดยเชื่อมต่อจุดสูงและต่ำที่สำคัญด้วยเส้นโครงสร้างแบบไดนามิก ซึ่งช่วยให้เทรดเดอร์สามารถรับรู้ทิศทางแนวโน้ม การต่อเนื่องของแนวโน้ม และจุดกลับตัวที่เป็นไปได้ได้ทันทีโดยไม่ต้องทำเครื่องหมายสวิงตลาดด้วยตนเอง
นอกจากนี้ โครงสร้างตลาด SC ยังจัดประเภทจุดโครงสร้างใหม่ทุกจุดโดยอัตโนมัติตามคำนิยามโครงสร้างตลาดมาตรฐาน:
- HH (Higher High)
- HL (Higher Low)
- LH (Lower High)
- LL (Lower Low)
โดยการรวมการตรวจจับสวิงอัตโนมัติกับการติดป้ายโครงสร้างตลาดแบบเรียลไทม์ เทรดเดอร์สามารถเข้าใจได้อย่างรวดเร็วว่าตลาดกำลังเป็นแนวโน้มหรือรวมตัว หรือแสดงสัญญาณของการกลับตัวของแนวโน้มที่เป็นไปได้
คุณสมบัติหลัก
• การตรวจจับจุดสูงสุดและต่ำสุดของสวิงที่สำคัญโดยอัตโนมัติ
• เส้นโครงสร้างแบบไดนามิกที่เชื่อมต่อจุดหมุนของตลาด
• การระบุจุดสูงสุดที่สูงขึ้น (Higher Highs - HH) โดยอัตโนมัติ
• การระบุจุดต่ำสุดที่สูงขึ้น (Higher Lows - HL) โดยอัตโนมัติ
• การระบุจุดสูงสุดที่ต่ำลง (Lower Highs - LH) โดยอัตโนมัติ
• การระบุจุดต่ำสุดที่ต่ำลง (Lower Lows - LL) โดยอัตโนมัติ
• การแสดงภาพโครงสร้างตลาดขาขึ้นและขาลงอย่างชัดเจน
• การรับรู้ทันทีของรูปแบบการต่อเนื่องและการกลับตัวของแนวโน้ม
• ใช้งานได้กับทุกตลาดและกรอบเวลา
• การนำเสนอแผนภูมิที่สะอาดและใช้งานง่าย
การแสดงภาพโครงสร้างตลาด
โครงสร้างตลาด SC ประเมินการสวิงของราคาอย่างต่อเนื่องและติดป้ายจุดโครงสร้างที่ได้รับการยืนยันใหม่ทุกจุด
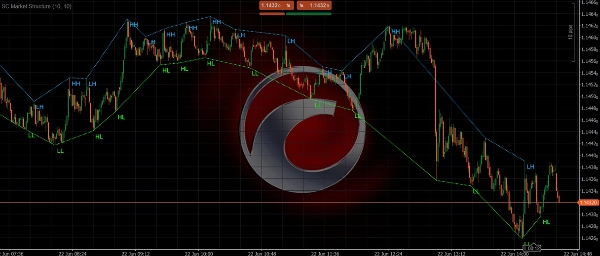
โครงสร้างขาขึ้น
โครงสร้างตลาดขาขึ้นจะถูกระบุเมื่อราคาสร้าง:
• จุดสูงสุดที่สูงขึ้น (Higher Highs - HH)
• จุดต่ำสุดที่สูงขึ้น (Higher Lows - HL)
ลำดับนี้แสดงให้เห็นว่าผู้ซื้อยังคงควบคุมตลาดและแนวโน้มขาขึ้นยังคงอยู่
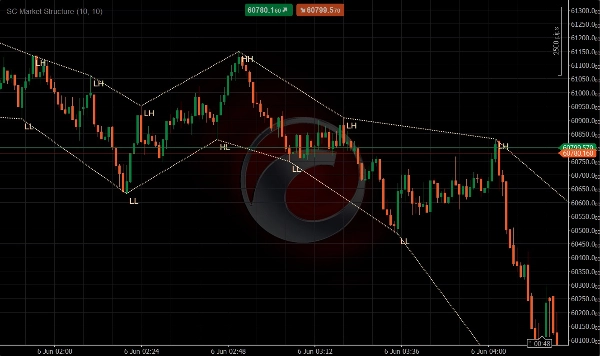
โครงสร้างขาลง
โครงสร้างตลาดขาลงจะถูกระบุเมื่อราคาสร้าง:
• จุดสูงสุดที่ต่ำลง (Lower Highs - LH)
• จุดต่ำสุดที่ต่ำลง (Lower Lows - LL)
ลำดับนี้แสดงให้เห็นว่าผู้ขายยังคงควบคุมตลาดและแนวโน้มขาลงยังคงอยู่
ตัวบ่งชี้จะเชื่อมต่อจุดโครงสร้างเหล่านี้ด้วยเส้นแนวโน้มแบบไดนามิก ช่วยให้เทรดเดอร์ติดตามวิวัฒนาการของโครงสร้างราคาแบบเรียลไทม์
ทำไมต้องใช้โครงสร้างตลาด SC
การเข้าใจโครงสร้างตลาดเป็นหนึ่งในแง่มุมที่สำคัญที่สุดของการเทรดด้วยการเคลื่อนไหวของราคา
เทรดเดอร์หลายคนวาดจุดสูงสุด จุดต่ำสุด และโครงสร้างแนวโน้มด้วยตนเอง ซึ่งอาจใช้เวลานานและมีความลำเอียง
โครงสร้างตลาด SC ช่วยทำให้กระบวนการนี้เป็นอัตโนมัติโดยการระบุจุดหมุนโครงสร้างอย่างเป็นกลางและติดป้ายตามหลักการโครงสร้างตลาดมืออาชีพ
ซึ่งช่วยให้เทรดเดอร์สามารถ:
• อ่านทิศทางแนวโน้มได้เร็วขึ้น
• ระบุการกลับตัวที่เป็นไปได้ได้เร็วขึ้น
• ยืนยันการตั้งค่าการต่อเนื่องของแนวโน้ม
• ปรับปรุงจังหวะเข้าและออก
• รักษาแผนภูมิให้สะอาดและเป็นระเบียบมากขึ้น
เหมาะสำหรับ
• เทรดเดอร์ที่ใช้ Price Action
• สแคปเปอร์
• เทรดเดอร์รายวัน
• เทรดเดอร์สวิง
• เทรดเดอร์ติดตามแนวโน้ม
• เทรดเดอร์โครงสร้างตลาด
• เทรดเดอร์ Smart Money Concept (SMC)
• เทรดเดอร์ที่ต้องการการวิเคราะห์โครงสร้างอย่างเป็นกลาง
หมายเหตุสำคัญ
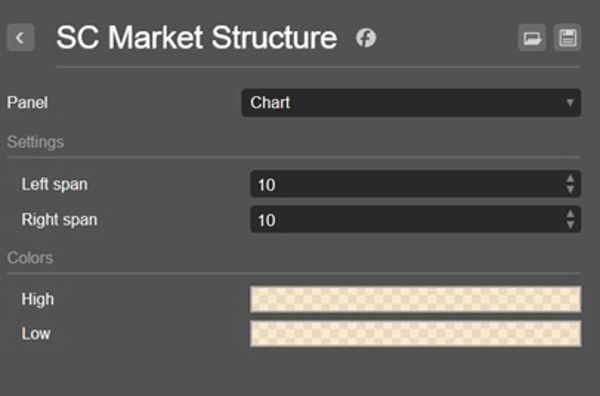
โครงสร้างตลาด SC ระบุโครงสร้างตลาดโดยอิงจากจุดสูงสุดและต่ำสุดของสวิงที่ได้รับการยืนยัน ป้ายและเส้นโครงสร้างจะถูกสร้างขึ้นหลังจากจุดหมุนได้รับการยืนยันตามการตั้งค่าการคำนวณที่เลือกเท่านั้น
การปรับความไวจะส่งผลต่อความถี่ในการระบุและแสดงจุดโครงสร้างใหม่
แตกต่างจากตัวบ่งชี้ MACD แบบดั้งเดิม แนวคิดภาพของมันถูกสร้างขึ้นโดยการผสานข้อมูลโมเมนตัมเข้ากับการวิเคราะห์การเคลื่อนไหวของราคา ด้วยเหตุนี้ การใช้ตัวบ่งชี้ในแผงแยกจึงไม่แนะนำและไม่ให้ประสบการณ์ผู้ใช้ตามที่ตั้งใจไว้
อ่านแนวโน้ม ติดตามโครงสร้าง เทรดด้วยความมั่นใจ
สรุป
By continuously analyzing price action, SC Market Structure helps traders quickly determine trend direction, recognize trend continuation, and spot potential reversal points without manual chart annotations. It supports all markets and timeframes, providing a clean and intuitive chart presentation.
This tool is suited for price action traders, scalpers, day traders, swing traders, trend followers, and those using Smart Money Concepts or seeking objective market structure analysis. Sensitivity settings allow customization of pivot detection frequency. The indicator integrates momentum information into price action analysis and is designed for direct chart overlay rather than separate panels.
รีวิวจากลูกค้า
5 | 100 % | |
4 | 0 % | |
3 | 0 % | |
2 | 0 % | |
1 | 0 % |


