Penerangan
Penunjuk ANALISIS TEKNIKAL adalah penyelesaian analisis teknikal lanjutan yang dibangunkan untuk platform cAlgo, menggabungkan pelbagai penunjuk teknikal yang memfokuskan pada mengenal pasti tren yang kukuh, momentum pasaran, dan pengesahan volum. Ia menggabungkan ADX (Indeks Arah Purata) dengan analisis cerun, penapisan volum, dan analisis teknikal pelbagai penunjuk masa nyata, menawarkan pedagang pandangan yang menyeluruh dan boleh dipercayai untuk membuat keputusan.
🔍 Strategi Utama
1. Asas: ADX + DI (Sistem Pergerakan Arah)
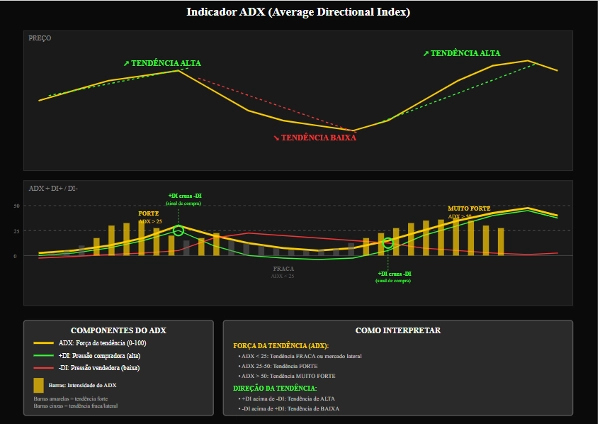
Teras penunjuk adalah ADX (Indeks Arah Purata), yang mengukur kekuatan tren.
Komponen +DI (Penunjuk Arah Positif) dan -DI (Penunjuk Arah Negatif) mengenal pasti arah tren:
+DI > -DI → Tren menaik
-DI > +DI → Tren menurun
2. Analisis Momentum Dinamik dengan Cerun
Cerun ADX, +DI, dan -DI dikira menggunakan regresi linear.
Ini membolehkan mengenal pasti sama ada tren itu:
Meningkat kekuatan (cerun positif)
Kehilangan kekuatan (cerun negatif)
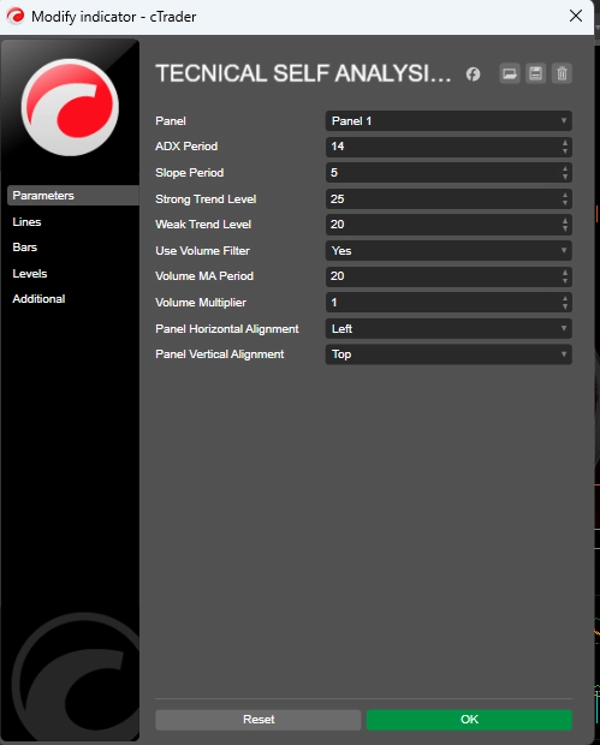
3. Tahap Rujukan
Tahap Tren Kuat: Tahap di atas mana tren dianggap kuat (lalai: 25)
Tahap Tren Lemah: Tahap minimum untuk menganggap tren sah (lalai: 20)
Tren di bawah tahap lemah dianggap sebagai mendatar atau tanpa arah yang jelas.
📈 Penjanaan Isyarat
Syarat Beli
✅ +DI melintasi ke atas -DI
✅ ADX di atas tahap tren lemah (Tahap Tren Lemah)
✅ Cerun ADX dan +DI positif
✅ Pengesahan volum (pilihan)
Syarat Jual
✅ -DI melintasi ke atas +DI
✅ ADX di atas tahap tren lemah (Tahap Tren Lemah)
✅ Cerun ADX dan -DI positif
✅ Pengesahan volum (pilihan)
Isyarat Kuat: Apabila ADX berada di atas Tahap Tren Kuat dan cerun adalah sangat positif, penunjuk menghasilkan isyarat yang diperkuat, mengelakkan kemasukan berulang berturut-turut. 📊 Penapis Volum (Pilihan)
Penunjuk mungkin memerlukan pengesahan volum sebelum menghasilkan isyarat.
Volum semasa mesti lebih besar atau sama dengan purata bergerak volum × pengganda.
Ini membantu menapis pecahan palsu dan isyarat dalam pasaran yang kurang cair.
🧠 Analisis Teknikal Lanjutan (Panel Interaktif)
ANALISIS TEKNIKAL termasuk dua panel interaktif pada carta:
1. MAKLUMAT TREN
Jenis Tren: Tren menaik / Tren menurun / Mendatar
Kekuatan Tren: Kuat / Lemah
Momentum: Menguat / Melemah / Stabil
Nilai ADX, +DI, -DI dan Cerun semasa
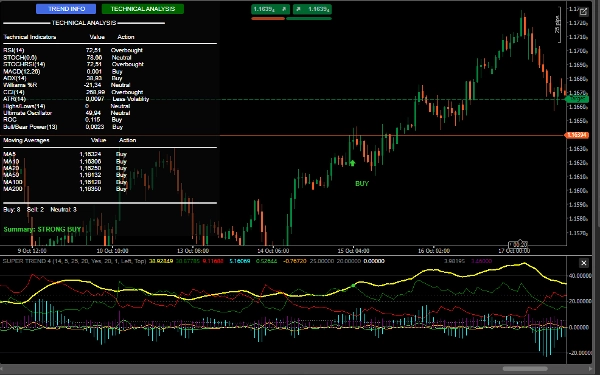
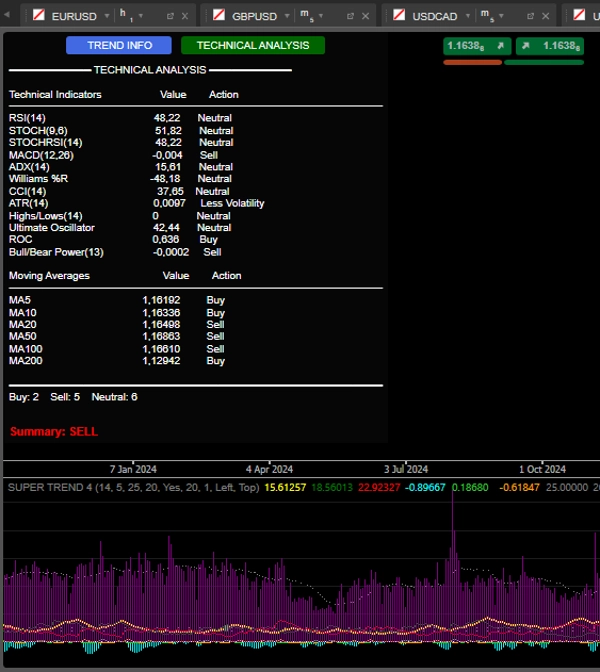
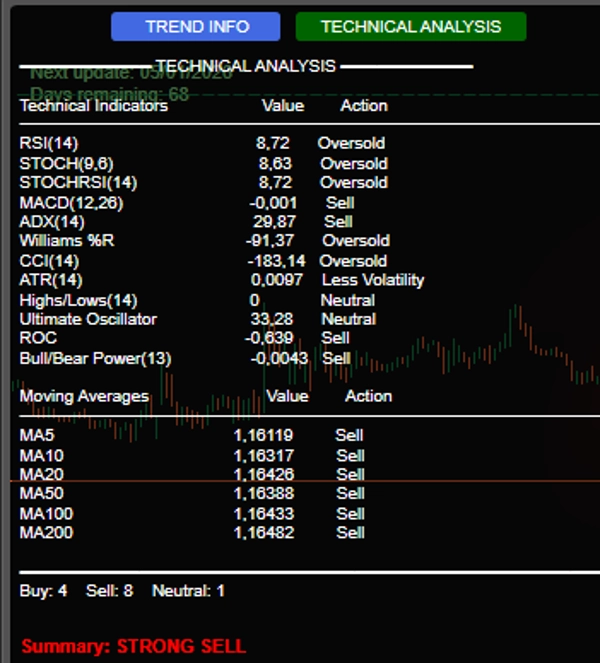
2. ANALISIS TEKNIKAL
Melakukan analisis pelbagai penunjuk masa nyata, termasuk:
RSI(14) – Jual Beli Berlebihan
Stochastic(14) – Momentum
MACD(12,26) – Persilangan dan divergensi
Williams %R – Ekstrem pasaran
CCI(14) – Penyimpangan dari harga tipikal
ROC(12) – Kadar perubahan
Ultimate Oscillator – Pengesahan kekuatan
Bull/Bear Power – Tekanan Beli/Jual
Purata Bergerak (5,10,20,50,100,200) – Tren jangka panjang
Ringkasan Akhir: Sistem mengira isyarat beli/jual/netral dan mengeluarkan cadangan yang jelas:
BELI KUAT (≥7 isyarat beli)
BELI
JUAL
JUAL KUAT (≥7 isyarat jual)
NETRAL
🔔 Amaran dan Visualisasi
Isyarat visual pada carta:
Anak panah hijau/merah dengan label "BELI"/"JUAL"
Pemberitahuan bunyi (Windows)
Log terperinci dalam konsol dengan:
Masa isyarat
Nilai ADX, DI dan volum (jika diaktifkan)
🛡️ Kelebihan Kompetitif
✅ Integrasi pelbagai penunjuk dalam satu panel
✅ Fokus pada kekuatan dan arah tren (bukan hanya harga)
✅ Penapis volum untuk kebolehpercayaan yang lebih tinggi
✅ Antara muka interaktif dan informatif
✅ Isyarat jelas dengan amaran visual dan bunyi
Ini adalah versi ujian.