Opis
SC MACD Dots
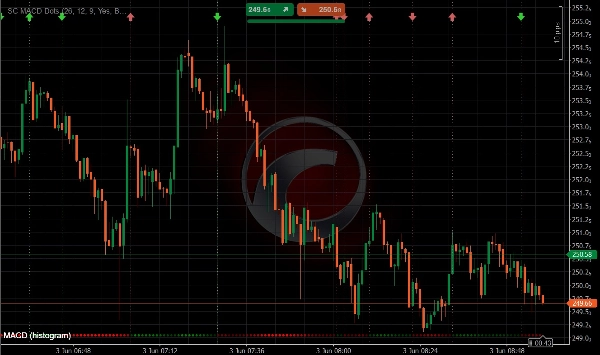
SC MACD Dots to minimalistyczna wersja klasycznego wskaźnika MACD, zaprojektowana tak, aby zapewnić czytelniejszy i bardziej intuicyjny obraz momentum bez zaśmiecania wykresu tradycyjnymi słupkami histogramu i wieloma liniami.
Zamiast wyświetlać standardowy histogram MACD, wskaźnik używa dynamicznych kropek do reprezentowania wartości histogramu w czasie. Takie podejście tworzy nowoczesny i wizualnie efektywny układ, który pozwala traderom natychmiast identyfikować zmiany momentum, przyspieszenie trendu oraz potencjalne odwrócenia.
Kropki dostosowują zarówno kolor, jak i intensywność w zależności od siły histogramu, co ułatwia rozpoznanie rosnącego lub malejącego momentum na pierwszy rzut oka.
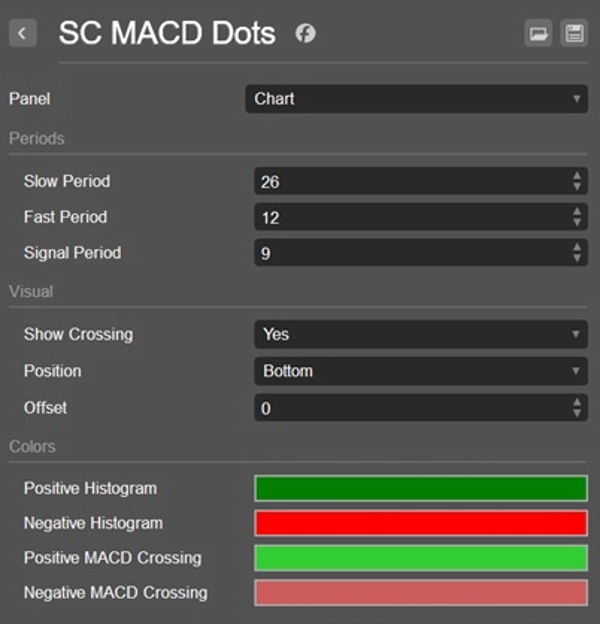
Dodatkowo SC MACD Dots automatycznie podświetla przecięcia linii sygnału MACD, umożliwiając traderom szybkie rozpoznanie potencjalnych zmian trendu i przesunięć momentum.
Kluczowe cechy
• Histogram wyświetlany za pomocą dynamicznych kropek zamiast tradycyjnych słupków
• Czytelniejszy i mniej rozpraszający wygląd wykresu
• Kolor i intensywność kropek zmieniają się dynamicznie w zależności od siły histogramu
• Natychmiastowa wizualna identyfikacja rosnącego i malejącego momentum
• Automatyczne wykrywanie zdarzeń przecięcia MACD
• Różne kolory dla przecięć wzrostowych i spadkowych
• Przecięcia w strefie dodatniej i ujemnej używają różnych stylów wizualnych
• Szybsza wizualna interpretacja zmian momentum i odwróceń trendu
• Idealny do skalpowania, handlu intraday, swing tradingu i handlu dyskrecjonalnego
Wizualizacja przecięć
SC MACD Dots podświetla każde zdarzenie przecięcia MACD:
• Przecięcia wzrostowe (bycze) są wyświetlane za pomocą dedykowanych kolorów byczych
• Przecięcia spadkowe (niedźwiedzie) są wyświetlane za pomocą dedykowanych kolorów niedźwiedzich
• Przecięcia występujące powyżej linii zerowej (dodatnia strefa MACD) używają innej palety kolorów niż te poniżej linii zerowej (ujemna strefa MACD)
• Pozwala to traderom natychmiast odróżnić silniejsze i słabsze sygnały momentum
Dlaczego warto używać SC MACD Dots
Tradycyjne wskaźniki MACD często wymagają od traderów monitorowania wielu linii i słupków histogramu jednocześnie, co może sprawić, że wykresy wyglądają na zatłoczone i trudne do odczytania.
SC MACD Dots został stworzony z jednym celem:
uproszczenie analizy MACD przy zachowaniu wszystkich istotnych informacji o momentum.
Adaptacyjna wizualizacja kropek pozwala traderom szybko ocenić siłę histogramu, przyspieszenie momentum, jego spowolnienie oraz sygnały przecięcia bez rozpraszania niepotrzebnymi elementami wizualnymi.
Łącząc dynamiczne kropki histogramu z inteligentną wizualizacją przecięć, traderzy mogą szybciej identyfikować okazje i utrzymywać czytelniejsze środowisko pracy.
Idealny dla
• Traderów preferujących czyste wykresy
• Traderów momentum
• Skalperów i traderów dziennych
• Traderów swingowych
• Ustawienia handlu z wieloma wskaźnikami
• Szybką analizę rynku
• Traderów polegających na sygnałach przecięcia MACD
Ważna uwaga
SC MACD Dots jest zaprojektowany do użycia bezpośrednio na głównym wykresie cenowym.
W przeciwieństwie do tradycyjnych wskaźników MACD, jego koncepcja wizualna opiera się na integracji informacji o momentum z analizą ruchu cen. Z tego powodu używanie wskaźnika w osobnym panelu nie jest zalecane i nie zapewnia zamierzonego doświadczenia użytkownika.
Proste. Czyste. Potężne.
Podsumowanie
Opinie klientów
5 | 100 % | |
4 | 0 % | |
3 | 0 % | |
2 | 0 % | |
1 | 0 % |


![Logo „[Hamster-Coder] Bollinger Bands”](https://cdn.ctrader.com/image/webp/21d8e5d6-fb11-4bac-b9ee-cd05c2b76804_30327)