Opis
DOSTĘPNA ZAKTUALIZOWANA WERSJA — TUTAJ
Wydano zaktualizowaną wersję tego wskaźnika z krytycznymi poprawkami i ulepszeniami:
- Naprawiona dystrybucja wolumenu: Proporcjonalne przypisanie oparte na nakładaniu się świec (zamiast 100% do wszystkich dotkniętych poziomów)
- Naprawione wykrywanie VAH/VAL: Tolerancja teraz skalowana jest względem wysokości poziomu zamiast wartości na stałe
- Naprawione pozycjonowanie tekstu: Dynamiczne przesunięcia oparte na interwale czasowym zamiast stałych dni
- Parametr przesunięcia strefy czasowej: Dla profili DateTime
- Parametr pozycji tekstu: Opcja umiejscowienia po lewej/prawej stronie dla trybu lookback
- Ulepszenia wydajności: Wyszukiwanie binarne dla wyszukiwania DateTime, buforowane obliczenia wolumenu, zoptymalizowane operacje na słownikach
__________________________________________________________________________________________
WAŻNE UWAGI - PRZECZYTAJ NAJPIERW
Wolumen Forex nie jest rzeczywistym wolumenem
Wolumen na rynku forex to wolumen tickowy — liczy, ile razy zmieniła się cena. NIE liczy, ile pieniędzy zostało wymienionych.
Czego wolumen tickowy nie może pokazać
- Wielkości transakcji. Transakcja za 100 USD i za 10 000 000 USD liczą się jako 1 tick.
- Rzeczywistego przepływu pieniędzy. Nie możesz zobaczyć, czy cenę poruszyły duże czy małe pieniądze.
- Prawdziwej płynności. Nie możesz zobaczyć, ile zleceń czeka na rynku.
- Aktywności banków. Banki widzą rzeczywiste dane o wolumenie. Ty nie.
Co to oznacza
Wolumen tickowy pokazuje tylko, jak często zmieniała się cena — nie pieniądze za tym stojące. To powoduje problemy:
- Nie możesz śledzić banków ani instytucji. One korzystają z rzeczywistych danych o wolumenie, do których nie masz dostępu.
- Nie możesz udowodnić teorii "smart money". Te idee wymagają rzeczywistego wolumenu, nie liczby ticków.
- Nie możesz ocenić prawdziwej płynności. Aktywność ticków nie pokazuje głębokości zleceń ani rzeczywistej siły rynku.
- Nie możesz zmierzyć prawdziwej siły kupna lub sprzedaży. Wiele małych transakcji wygląda tak samo jak jedna duża transakcja instytucjonalna.
- Skoki wolumenu mogą wprowadzać w błąd. Skok może być tylko szumem algorytmicznym, a nie rzeczywistym zainteresowaniem handlem.
Jak prawidłowo używać tego wskaźnika
- Traktuj go jako miernik aktywności, a nie miernik pieniędzy. Wysoki wolumen tickowy = rynek jest zajęty. Niski wolumen tickowy = rynek jest spokojny. Nic więcej.
- Porównuj aktywność między różnymi okresami. Używaj go, aby zobaczyć: Czy sesja londyńska jest bardziej aktywna niż nowojorska? Czy dziś jest bardziej aktywnie niż wczoraj? Czy okres trendu jest bardziej aktywny niż konsolidacja?
- Łącz go ze strukturą ceny. Używaj wsparcia/oporu, punktów zwrotnych lub BOS/ChoCH razem z wolumenem. Kontekst cenowy zapobiega fałszywym sygnałom z hałaśliwych skoków wolumenu.
- Obserwuj aktywność na ważnych poziomach cenowych. Gdy cena testuje kluczowy poziom i wolumen tickowy rośnie, oznacza to, że więcej traderów jest aktywnych. NIE oznacza to, że zaangażowani są duzi gracze.
- Nie zakładaj, że pokazuje aktywność instytucjonalną. Wolumen tickowy nie pokazuje akumulacji, dużych zleceń ani "smart money". Używaj go tylko do mierzenia rytmu i tempa.
__________________________________________________________________________________________
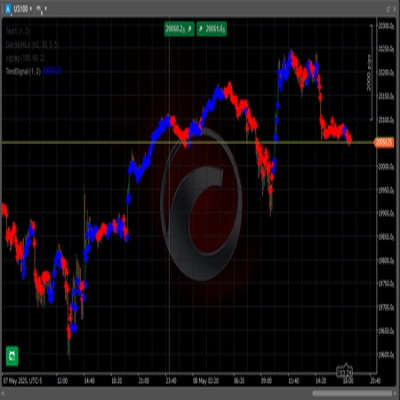
Wizualizuj rozkład wolumenu i czas spędzony przy cenie za pomocą POC, Value Area i śledzenia Market Profile TPO.
Ten wskaźnik pokazuje rozkład wolumenu za pomocą koncepcji Market Profile. Wyświetla Point of Control (poziom o najwyższej aktywności ticków), granice Value Area (gdzie odbywał się największy handel), sekwencje liter TPO (czas spędzony przy każdej cenie) oraz wizualizację delty, która dzieli aktywność ticków według kierunku świecy.
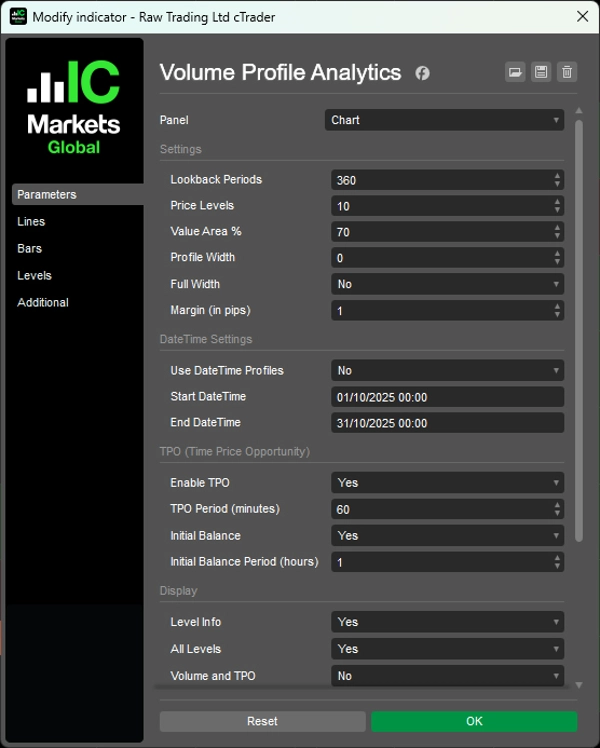
Możesz wybrać okresy lookback lub ustawić konkretne zakresy dat, wyświetlać słupki wolumenu jako proporcjonalne lub pełnej szerokości, przełączać się między wszystkimi poziomami lub tylko kluczowymi oraz dostosowywać kolory dla aktywności byków/niedźwiedzi.
CECHY
Analiza rozkładu wolumenu
- Point of Control (POC): Poziom cenowy z najwyższą aktywnością — gdzie cena spędziła najwięcej czasu
- Value Area (VA): Konfigurowalna strefa koncentracji aktywności (domyślnie 70%) — gdzie odbywał się największy handel
- VAH/VAL: Granice Value Area High/Low — potencjalne poziomy wsparcia/oporu
- Wizualizacja delty: Podzielone słupki pokazują kierunek świecy na każdym poziomie cenowym
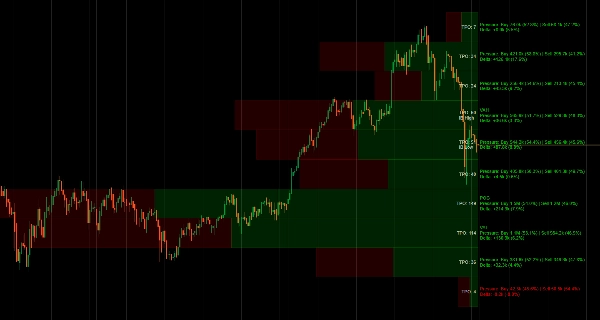
Market Profile TPO
- Śledzenie Time Price Opportunity: Liczy, ile okresów czasu handlowano na każdej cenie
- Litery TPO: Wizualna reprezentacja czasu spędzonego przy cenie (sekwencja A-Z)
- Initial Balance (IB): Zakres pierwszej godziny — ważny dla struktury day tradingu
- Markery IB High/Low: Ekstrema zakresu otwarcia
Elastyczne opcje lookback
- Na podstawie okresu: Ustaw liczbę słupków do analizy (np. ostatnie 120 słupków)
- Zakres DateTime: Zakotwicz profil między konkretnymi datami/godzinami do analizy zdarzeń
- Dynamiczna szerokość: Automatyczne skalowanie lub profile o stałej szerokości
Opcje wyświetlania
- Słupki wolumenu: Proporcjonalna szerokość (skalowana aktywnością) lub słupki o pełnej szerokości
- Podział kierunku świecy w każdym słupku
- Obliczenia delty z procentami
- Przełączanie między wszystkimi poziomami lub tylko kluczowymi (POC, VAH, VAL)
- Kontrola widoczności szczegółów wolumenu/TPO
- Podział kierunkowy z procentami
- Regulowana wielkość czcionki i marginesy oparte na pipach
Dostosowanie kolorów
- Niezależne kolory dla słupków kierunku byków/niedźwiedzi
- Oddzielne kolory tekstu dla dodatniej/ujemnej delty
- Kolor tekstu specyficzny dla TPO
Optymalizacja wydajności
- Buforowane wyszukiwania czasu i efektywne rysowanie prostokątów
- Minimalne przeliczanie dla płynnej wydajności
- Profesjonalne obliczenia delty oparte na strukturze świecy
__________________________________________________________________________________________
WIĘCEJ DARMOWYCH WSKAŹNIKÓW
Odkryj szeroki zakres narzędzi analizy rynku — od struktury i wolumenu po regresję, zmienność i niestandardowe interwały czasowe.
Kod źródłowy jest dostępny na GitHub repozytorium.
Wszystko darmowe do użytku. Ale jeśli chcesz wesprzeć kawą, możesz to zrobić tutaj.
Wsparcie/Oporność
Wolumen
- Profiler aktywności wolumenu
- Analizator efektywności wolumenu
- Analizy profilu wolumenu
- Profil wolumenu - zaktualizowany
- Analiza rozkładu wolumenu
- VWAP (Wolumenowo ważona średnia cena)
Średnie kroczące
- Zakotwiczona średnia krocząca
- Średnia krocząca skalowana odchyleniem
- Natychmiastowa linia trendu
- Adaptacyjna MA Kaufmana z Trend Vision
- Kanał średniej kroczącej
- Pakiet średnich kroczących
- Średnia krocząca kanału trendu
Narzędzia/niestandardowe
Oparte na regresji
Zmienność
Oscylatory
__________________________________________________________________________________________
ZASTRZEŻENIE
Trading wiąże się z ryzykiem. Ten wskaźnik jest przeznaczony wyłącznie do analizy technicznej — zawsze stosuj odpowiednie zarządzanie ryzykiem i handluj odpowiedzialnie.
OPINIE I ULEPSZENIA
Jeśli masz sugestie, prośby o funkcje lub pomysły na ulepszenia, zostaw komentarz na karcie Dyskusja. Twoja opinia pomaga ulepszyć wskaźnik dla wszystkich.
Podsumowanie
Users can customize lookback periods by number of bars or specific date/time ranges and choose between proportional or full-width volume bars. The indicator also provides delta visualization, splitting tick activity by candle direction with percentage breakdowns, and offers extensive display and color customization options for bullish and bearish activity.
This tool is optimized for performance with cached calculations and efficient drawing methods. It is designed to measure market activity rhythm and tempo based on tick volume, which counts price changes but does not represent actual traded money or liquidity. It is suitable for analyzing volume distribution and market structure across various trading sessions and timeframes.
Opinie klientów
5 | 100 % | |
4 | 0 % | |
3 | 0 % | |
2 | 0 % | |
1 | 0 % |