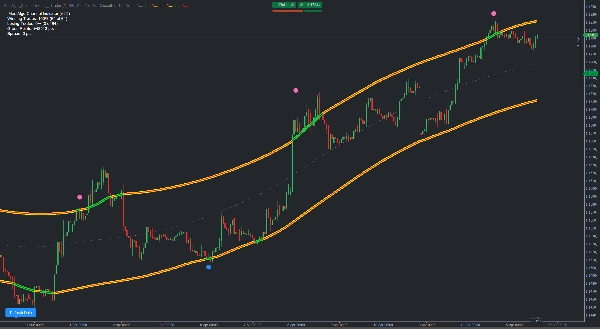
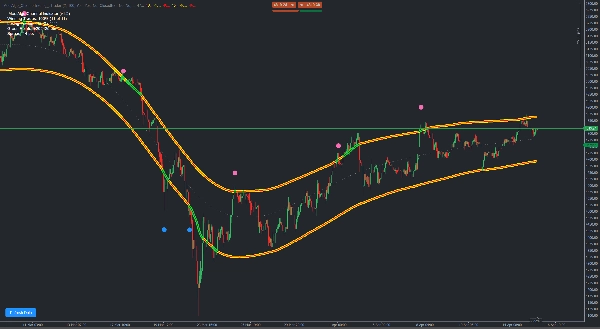
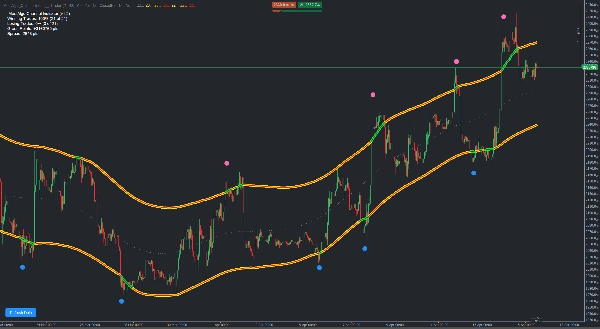
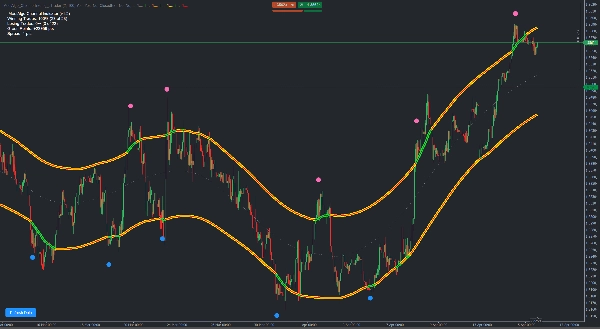
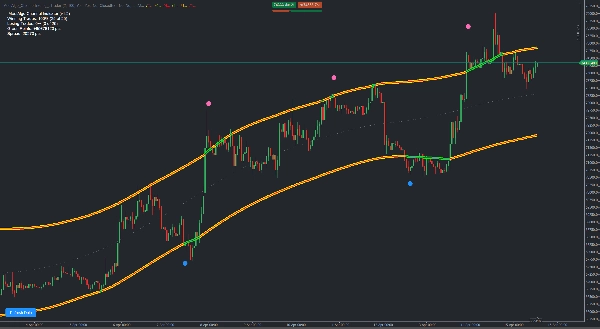
Corretores e props
Para empresas
00
Days
:
00
Hours
:
00
Minutes
:
00
Seconds
Indicador
Signal
MeetAlgo_ChannelTrading_cTrader
5.0
03/09/2025
209
Desktop
Desde 27/12/2024
Instalações gratuitas
209
Imagem carregada de "MeetAlgo_ChannelTrading_cTrader"Imagem carregada de "MeetAlgo_ChannelTrading_cTrader"Imagem carregada de "MeetAlgo_ChannelTrading_cTrader"Imagem carregada de "MeetAlgo_ChannelTrading_cTrader"

MeetAlgo Channel Trading is a volatility-based indicator built using envelope theory. The indicator plots dynamic upper and lower bands based on recent price movement and statistical deviation. These bands aim to represent expected price boundaries, and values plotted outside the range may signal a shift in volatility.

The channel is designed to reflect general market behavior by identifying price areas that are relatively high or low. When price approaches or exceeds the upper or lower bands, a directional arrow is plotted to suggest potential reversal zones. These signals can be interpreted in combination with other forms of analysis.

The band width adapts to changing volatility, providing flexibility during different market conditions. The core method reduces lag by using a custom smoothing formula based on average price range.


Parameters Configurations

  • Deviations: Adjusts the sensitivity of the bands to volatility.
  • Minimum Bar Redraw: Sets the number of bars required before recalculating the channel.
  • Show Analysis Report: Displays historical signal-based outcome statistics.

Notifications

  • Signal Bar: Select whether calculations are based on live or closed bars.
  • Pop-Up Alerts: Displays message alerts on the platform.
  • Email Alerts: Sends email messages (requires setup in the platform).
  • Push Alerts: Sends mobile alerts (requires platform configuration).
  • Sound Alerts: Plays audio alerts from the cTrader Sounds folder.
  • Sound File Names: Names of sound files to use for directional signals.


5.0
Avaliações: 1
5
100 %
4
0 %
3
0 %
2
0 %
1
0 %
Avaliações de clientes
July 22, 2025
Também poderá gostar de
Indicador
NAS100
NZDUSD
Martingale
+26
Daily TPO profile
Daily TPO profile indicator that calculates POC, VAH and VAL for each session. Plots the Point of Control and the 70% Va
Dhruvin Wick Candelssss
RSI‑powered robot for high‑volatility scalping, no fuss.
Zig zag v.1 Demo
ZigZag Pro DEMO – Multi-Swing Indicator for cTrader DEMO VERSION – 24 hours free trial! This is a DEMO version of the Z
Indicador
NAS100
NZDUSD
Martingale
+25
Volume Profile Suite trial7D
DEMO VERSION 7 DAYS VolumeProfileSuite is an advanced and flexible Volume Profile indicator for cTrader.
Indicador
Indices
RSI
Stocks
+5
REDGREENZONEREVERSAL
The Red & Green Zone Reversal Indicator detects overbought and oversold market conditions using Bollinger Bands and RSI.
Indicador
Indices
Prop
Stocks
+3
LT_Ind_SRZones
Automatic Support/Resistance zones from swing points.
Indicador
Bollinger
Repiptor BB Colored Width
Colored Bollinger Bands Width
Indicador
Indices
E7 BlackScholes Model
Option pricing using the BlackScholes model and the Math.Numerics packages
Indicador
NAS100
NZDUSD
Martingale
+26
Dynamic Trend Flux
Dynamic Trend Flux is a colored momentum oscillator based on the classic fast/slow EMA difference plus a signal line.
ictkillzonesfromnovem
ICT ALL KİLL ZONES, LONDON , ASİA, NY AM, NY LUNCH, NY PM
Indicador
Indices
Breakout
Forex
+2
Time zone pro
FREE Global Trading Sessions Indicator
Indicador
Breakout
Forex
Signal
+2
MACD Plus
A visually enhanced MACD with colored histograms to clearly show trend strength.
ReversalGuard
ReversalGuard Pro: Domina el Mercado con Zonas de Soporte y Resistencia de Alta Precisión"
Indicador
Grid
RSI
Breakout
+19
Buy and sell indicator
Buy and Sell Signals
Zig zag v.1
ZigZag Pro – Multi-Swing Indicator for cTrader Description: ZigZag Pro is a powerful and fully customizable swing indica
Indicador
NAS100
NZDUSD
XAUUSD
+14
ANCHORED DELTA CANDLE VOLUME PROFILE
Indicador
XAUUSD
Volume Profile Fixed Range - Pro
Professional Volume Profile Indicator - Shows volume distribution, POC, Value Areas & Buy/Sell pressure.
Indicador
VWAP
ZigZag
RSI
+6
RSI T3 overbought and oversold area