Descrição
Indicadores da Pinescriptlabs Store: 🤖Pinescriptlabs Store cBots :
ICT Power of 3 (cBot) Gold & BTC BreakoutSession Pivots(novo)YieldShield"
Linhas de Suporte &
Resistência SmartTrend
Sistema de Rompimento de Canal
Estrutura Dinâmica de Mercado
Análise de Pontos de Virada
Fibonacci Linear
Regressão Multi-temporal
Gap de Valor Justo de Momentum
Gradiente de Tendência Dinâmico
Viés de Vela Multi-Nível
Rastreador
Rastreador de Extremos Zig-Zag
Linhas de Tendência de Suporte e
Resistência Automáticas
Todos os Níveis de Suporte e
Resistência
Mapa de Liquidação de Alavancagem
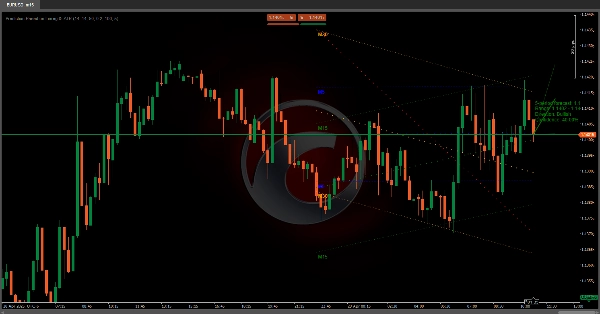
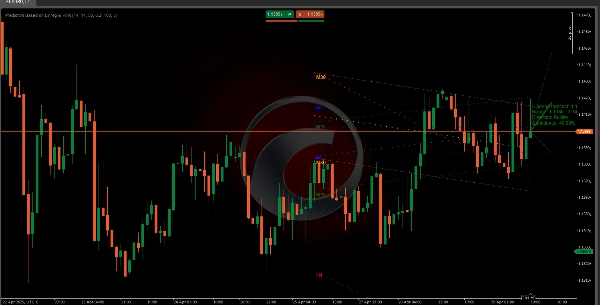
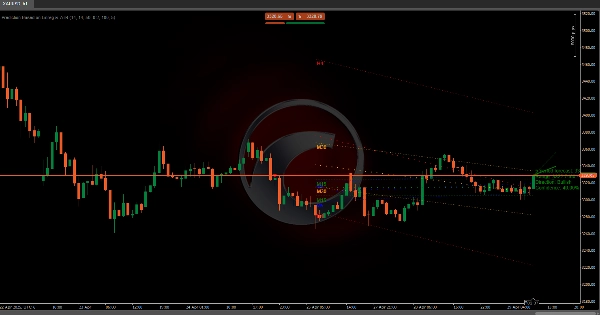
📈 Canal de Regressão Multi-Temporal & Algoritmo de Previsão ATR
Este sistema prevê o potencial movimento de preço de um ativo combinando análise de tendência multi-temporal 📊, volatilidade do mercado 📉 e confirmação por indicadores técnicos ✅. Seu objetivo é projetar uma faixa de preço futura com confiança mensurável, ideal para identificar oportunidades de risco-retorno de alta probabilidade 💰.
🔧 Como Funciona Passo a Passo
1️⃣ Análise de Tendência Multi-Temporal
- Canais de Regressão em Diferentes Timeframes:
O algoritmo analisa simultaneamente quatro timeframes diferentes (do curto ao longo prazo). Para cada um: -
- Calcula uma linha de tendência estatística baseada no comportamento histórico do preço.
- Define um canal de previsão ao redor dessa linha (usando a volatilidade passada para estabelecer limites superior/inferior).
- Influência Hierárquica:
Timeframes mais curtos têm mais peso na direção final, refletindo sua sensibilidade a movimentos recentes.
2️⃣ Integração de Volatilidade (ATR) 🌊
- Ajuste Dinâmico de Volatilidade:
As previsões se adaptam às condições atuais do mercado: -
- Alta volatilidade → Projeções mais amplas
- Baixa volatilidade → Ajustes conservadores
- Escalonamento da Faixa Futura:
A faixa de previsão ajusta-se automaticamente com base na volatilidade esperada.
3️⃣ Sistema de Confirmação de Tendência ✅
Combina quatro sinais-chave para validar ou desafiar a direção baseada na regressão:
- Cruzes de Médias Móveis (confirmação de tendência)
- Osciladores de Momentum (avaliação de força)
- Indicadores de Volatilidade (detecção de sobrecompra/sobrevenda)
- Análise de Divergência (indícios de reversão de tendência)
- Resultado: Um sistema de pontuação que reforça ou questiona a tendência prevista.
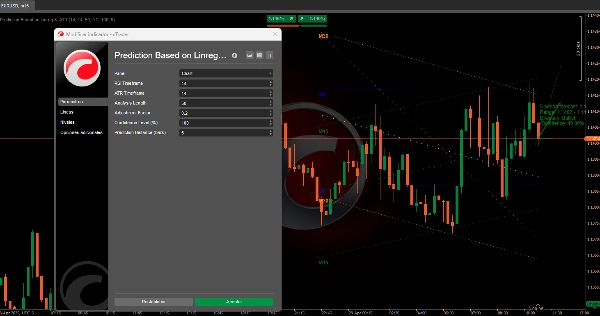
4️⃣ Cálculo de Confiança 🎯
- Alinhamento de Timeframes:
A confiança aumenta quando as tendências concordam entre os timeframes. - Limite Definido pelo Usuário:
Os traders podem definir um nível mínimo de confiança para filtrar apenas sinais de alta certeza.
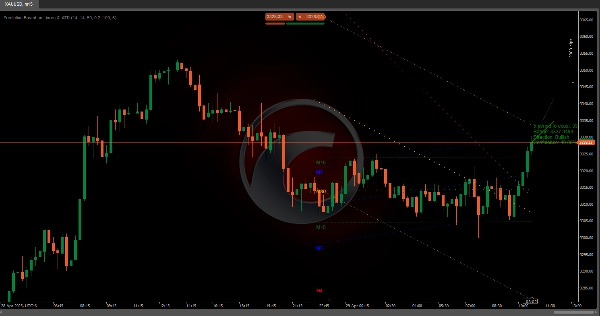
5️⃣ Visualização Intuitiva 📉📈
- Linha de Previsão:
Mostra o caminho central esperado (verde = alta 🟢, vermelho = baixa 🔴, cinza = neutro ⚪). - Bandas de Faixa:
Destacam a zona de movimento de preço mais provável, ajustada para volatilidade. - Etiqueta de Informação:
Resume o preço projetado, faixa, direção e nível de confiança.
🌟 Principais Vantagens
- Abordagem Multi-Dimensional: Combina tendência, volatilidade e momentum para reduzir sinais falsos.
- Autoajuste: Adapta-se automaticamente a mercados voláteis ou em tendência.
- Métricas Transparentes: Confiança quantificável ajuda a gerenciar expectativas.
📌 Exemplo Prático
Se o sistema detectar:
- Tendência de alta em timeframes curtos + confirmação de momentum
- Baixa volatilidade recente
- Forte concordância entre timeframes
→ Projeta uma alta de preço com faixa estreita e alta confiança (ex: 85%) 🚀
Resumo
The ATR component dynamically adjusts the prediction bands to current market conditions, widening during high volatility and narrowing during low volatility periods. A trend confirmation system integrates four key signals—moving average crosses, momentum oscillators, volatility indicators, and divergence analysis—to validate or question the regression-based trend, producing a scoring system that indicates trend strength.
Confidence levels are calculated based on alignment of trends across timeframes, with user-configurable thresholds to filter signals by certainty. Visualization includes a central prediction line (color-coded for bullish, bearish, or neutral trends), range bands highlighting probable price zones, and an info label summarizing projected price, range, direction, and confidence.
The indicator supports markets including cryptocurrencies (e.g., BTCUSD), commodities (e.g., XAUUSD), and others. It aims to identify high-probability risk-reward opportunities by combining trend, volatility, and momentum analysis in a self-adjusting, transparent framework.