説明
このインジケーターは、スマートマネーマーケット理論(ICT/SMC)の概念に基づき、市場の流動性ゾーンとオーダーブロックを識別します。
https://ctrader.com/pt/products/1560
https://ctrader.com/pt/products/1386
インジケーターは主に4つのステップで動作します:
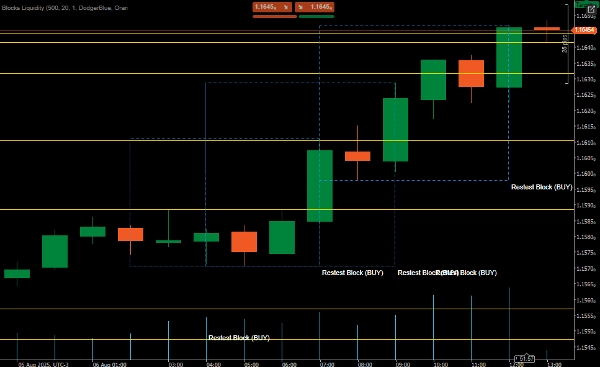
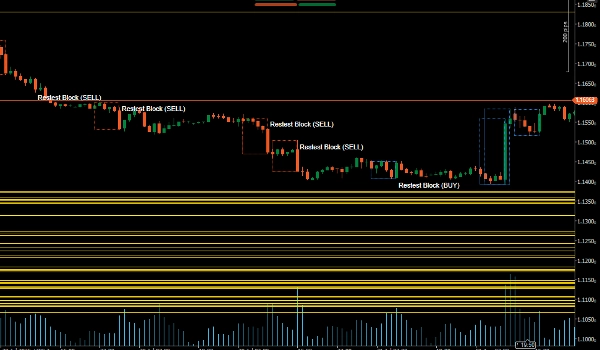
✅オーダーブロックの識別
インパルスの動きを検出(デフォルトで最低20ピップス)
インパルス前の統合ゾーンを見つける
買いまたは売りのブロックとして分類
✅流動性プールの識別
最近の高値と安値を流動性ゾーンとしてマーク
これらのエリアは潜在的なターゲットまたは停止ポイントを表します
✅リテストの確認
価格がオーダーブロックに戻る時をチェック
反転パターン(ピンバー/エンゴルフィング)と出来高で確認
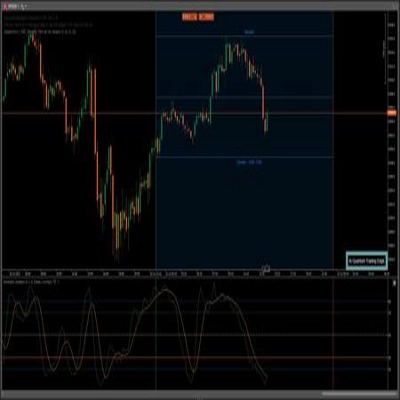
✅チャートの視覚化
オーダーブロックと流動性ゾーンを描画
確認時に音声アラートを発します
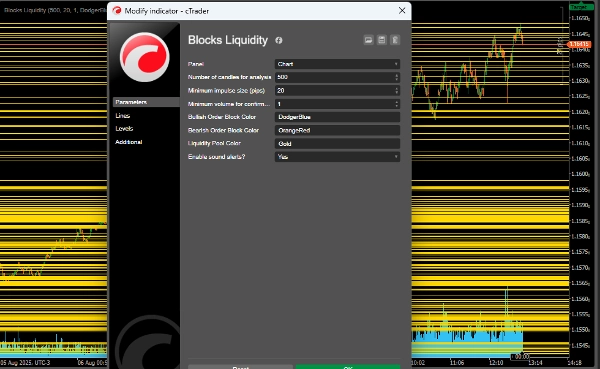
✅設定可能なパラメーター
LookbackPeriod:分析するキャンドルの数(デフォルト500)
MinImpulsePips:インパルスの最小サイズ(20ピップス)
MinVolumeThreshold:確認のための最小出来高(1.0)
強気/弱気ブロックおよび流動性ゾーンのカスタマイズ可能な色
音声アラートオプション
✅トレーディングロジック
強気(買い)ブロック:
統合と上昇モメンタムの後に形成される
潜在的なサポートゾーン
リテスト時の反転パターン+出来高でエントリーを確認
弱気(売り)ブロック:
統合と下降モメンタムの後に形成される
潜在的なレジスタンスゾーン
同様の方法でエントリーを確認
✅流動性プール:
最近の高値/安値をターゲットまたはストップとして
ストップオーダーが集中している可能性のあるエリア
概要
Key features include:
- Order Block Identification: Detects bullish and bearish blocks formed after consolidation and momentum shifts, serving as potential support or resistance zones.
- Liquidity Pool Identification: Highlights recent highs and lows that may act as targets or stop areas due to stop order concentration.
- Retest Confirmation: Validates entries by checking price returns to order blocks combined with reversal candlestick patterns (Pin Bar, Engulfing) and volume thresholds.
- Chart Visualization: Draws order blocks and liquidity zones with customizable colors and provides sound alerts upon confirmation.
- Configurable parameters such as lookback period, minimum impulse size, and volume threshold allow adaptation to different trading preferences.
This indicator supports analysis of price action dynamics to assist traders in identifying key market levels and potential trade entry points.
カスタマーレビュー
5 | 100 % | |
4 | 0 % | |
3 | 0 % | |
2 | 0 % | |
1 | 0 % |


![「[Stellar Strategies] Inside Bar with Signals」ロゴ](https://cdn.ctrader.com/image/webp/1d9e8bfa-3b2c-4440-bb37-5856902008a7_30683)